Matthew 24 doesn’t say earthquakes will increase. It says there will be wars, famines, and earthquakes “in various places,” and that these are “the beginning of birth pains.” That distinction matters more than it first appears — because it changes what we should actually be looking for in the data.
Birth pains don’t ramp up smoothly. They come in waves — distinct, sometimes far apart, then closer together, then intense — building toward a specific event rather than climbing a steady line. If that’s the right pattern to look for, the question isn’t “is any single metric going up.” The question is: are we seeing distinct episodes of multi-system convergence, and if so, what’s the shape of their recurrence?
I went back through six years of GCI tracking data — January 2020 through today — to find out.
Defining the wave
The GCI engine already has a built-in definition for this: Active Convergence — three or more of the seven primary risk channels (war, seismic activity, food stress, disease, economic stress, weather severity, civil unrest) simultaneously crossing into Pang State, our threshold for active crisis (72.5 or higher on a 100-point scale).
This isn’t a bar I set after looking at the data to make a point. It’s the same convergence criterion the dashboard has used from the start — the same one that determines whether a given day’s bulletin gets flagged MONITORING or something more severe.
So I asked a simple question: across six years, how many times has that bar actually been cleared, and for how long?
What the data shows
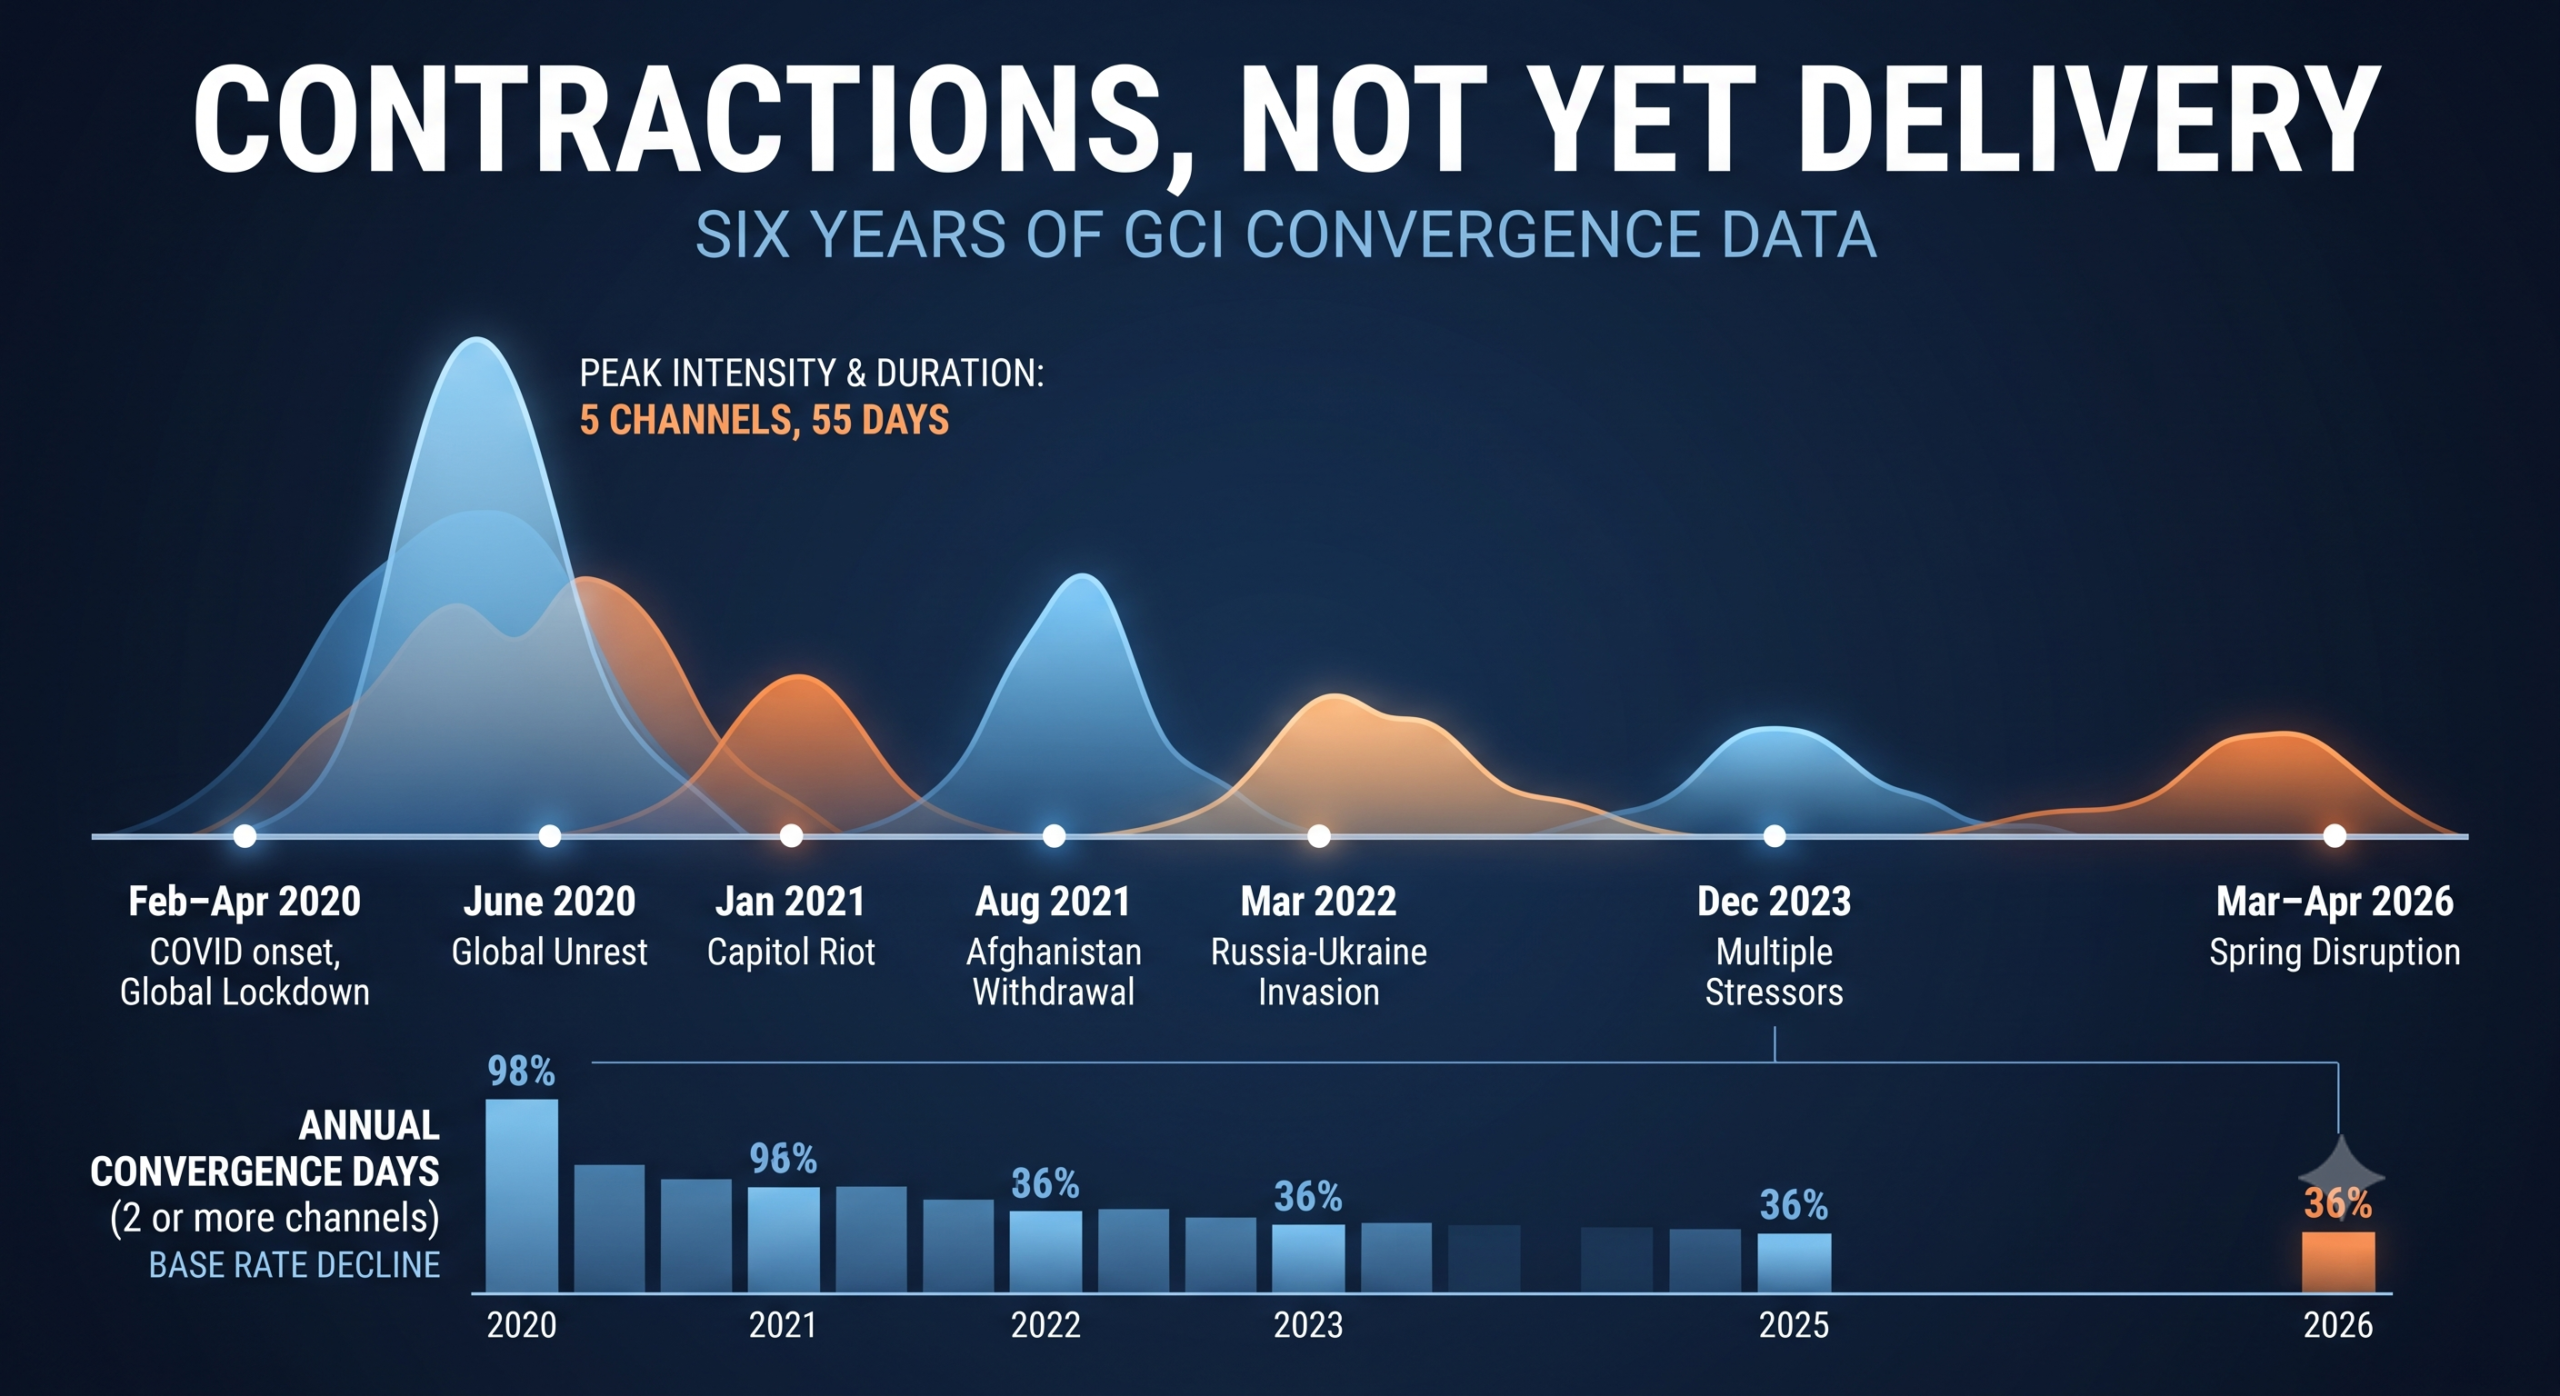
Filtering out one- or two-day noise and looking only at sustained episodes — a week or longer of continuous multi-channel convergence — seven distinct waves emerge:
- February–April 2020 (~55 days, peaking at 4 channels) — the COVID onset and global lockdown period
- June 2020 (10 days, peaking at 5 channels) — coinciding with global unrest tied to the George Floyd protests
- January 2021 (31 days, peaking at 5 channels) — the Capitol riot and its aftermath
- August 2021 (31 days, peaking at 4 channels) — the Afghanistan withdrawal, overlapping a Delta variant disease spike
- March 2022 (13 days, peaking at 3 channels) — the opening weeks of the Russia-Ukraine invasion, with food and economic stress spiking alongside war
- December 2023 (15 days, peaking at 3 channels)
- March–April 2026 (13 days, peaking at 4 channels) — the disruption tracked in this year’s spring data
Seven waves in six and a half years. Different triggers each time — a pandemic, civil unrest, a coup attempt, a war, a withdrawal — but the same underlying signature: multiple independent systems under simultaneous strain, cresting together, then subsiding.
That’s the part worth sitting with. 2020 was not a singular, unrepeated event. It was the first and strongest instance of a pattern that has recurred roughly every year to eighteen months since — under completely different specific causes each time. That’s not what a random walk looks like. That’s what a recurring pattern looks like, even if we can’t yet say it’s an accelerating one.
What it isn’t — yet
Here’s where honesty has to win over narrative. Two things are also true in this same dataset, and skipping past them would be building the argument on a foundation it can’t hold:
The waves haven’t gotten stronger. No episode since 2020 has matched its duration (55 days) or its peak intensity (5 simultaneous channels sustained for over a week). The trend line on both frequency and severity, if anything, points down through 2023–2025, before ticking back up with this spring’s event.
The overall base rate of “some convergence” has also declined. Looking at every day, not just the sustained waves — the percentage of days with 2 or more primary channels active simultaneously fell from 98% in 2020 to 36% so far in 2026. That’s a real number, and it cuts directly against any claim that we’re in a period of constantly building pressure. Most days, most years, the system is not converged.
So the pattern is not “it’s getting worse.” The pattern is: discrete, identifiable contractions, recurring on an irregular but real interval, that have not yet grown in either frequency or intensity beyond their 2020 starting point.
Contractions, not yet delivery
If the “birth pains” framing is right, this is exactly the phase you’d expect early in labor: real contractions, spaced out, sometimes intense, sometimes barely noticeable — but not yet close together, not yet increasing in strength. A midwife wouldn’t call that false labor. She also wouldn’t call it active labor. She’d call it early — the thing has started, but it hasn’t intensified into something urgent.
That’s the most honest reading of six years of GCI data. The waves are real. They keep showing up. They haven’t stopped. But they also haven’t escalated — not yet.
What would change that assessment isn’t a single bad week or one more war. It’s a measurable shift in the pattern itself: waves closer together than a year to eighteen months apart, or a wave that finally exceeds 2020’s depth and duration. Until the data shows that, the responsible claim is the modest one — not that we’re watching an emergency unfold, but that we’re watching the pattern the text describes actually recur, in real measured terms, right on schedule for something that has “not yet” reached its full intensity.
We’ll keep tracking it. That’s what the convergence delta is for.
I’m Wayne — and that’s our world today.