
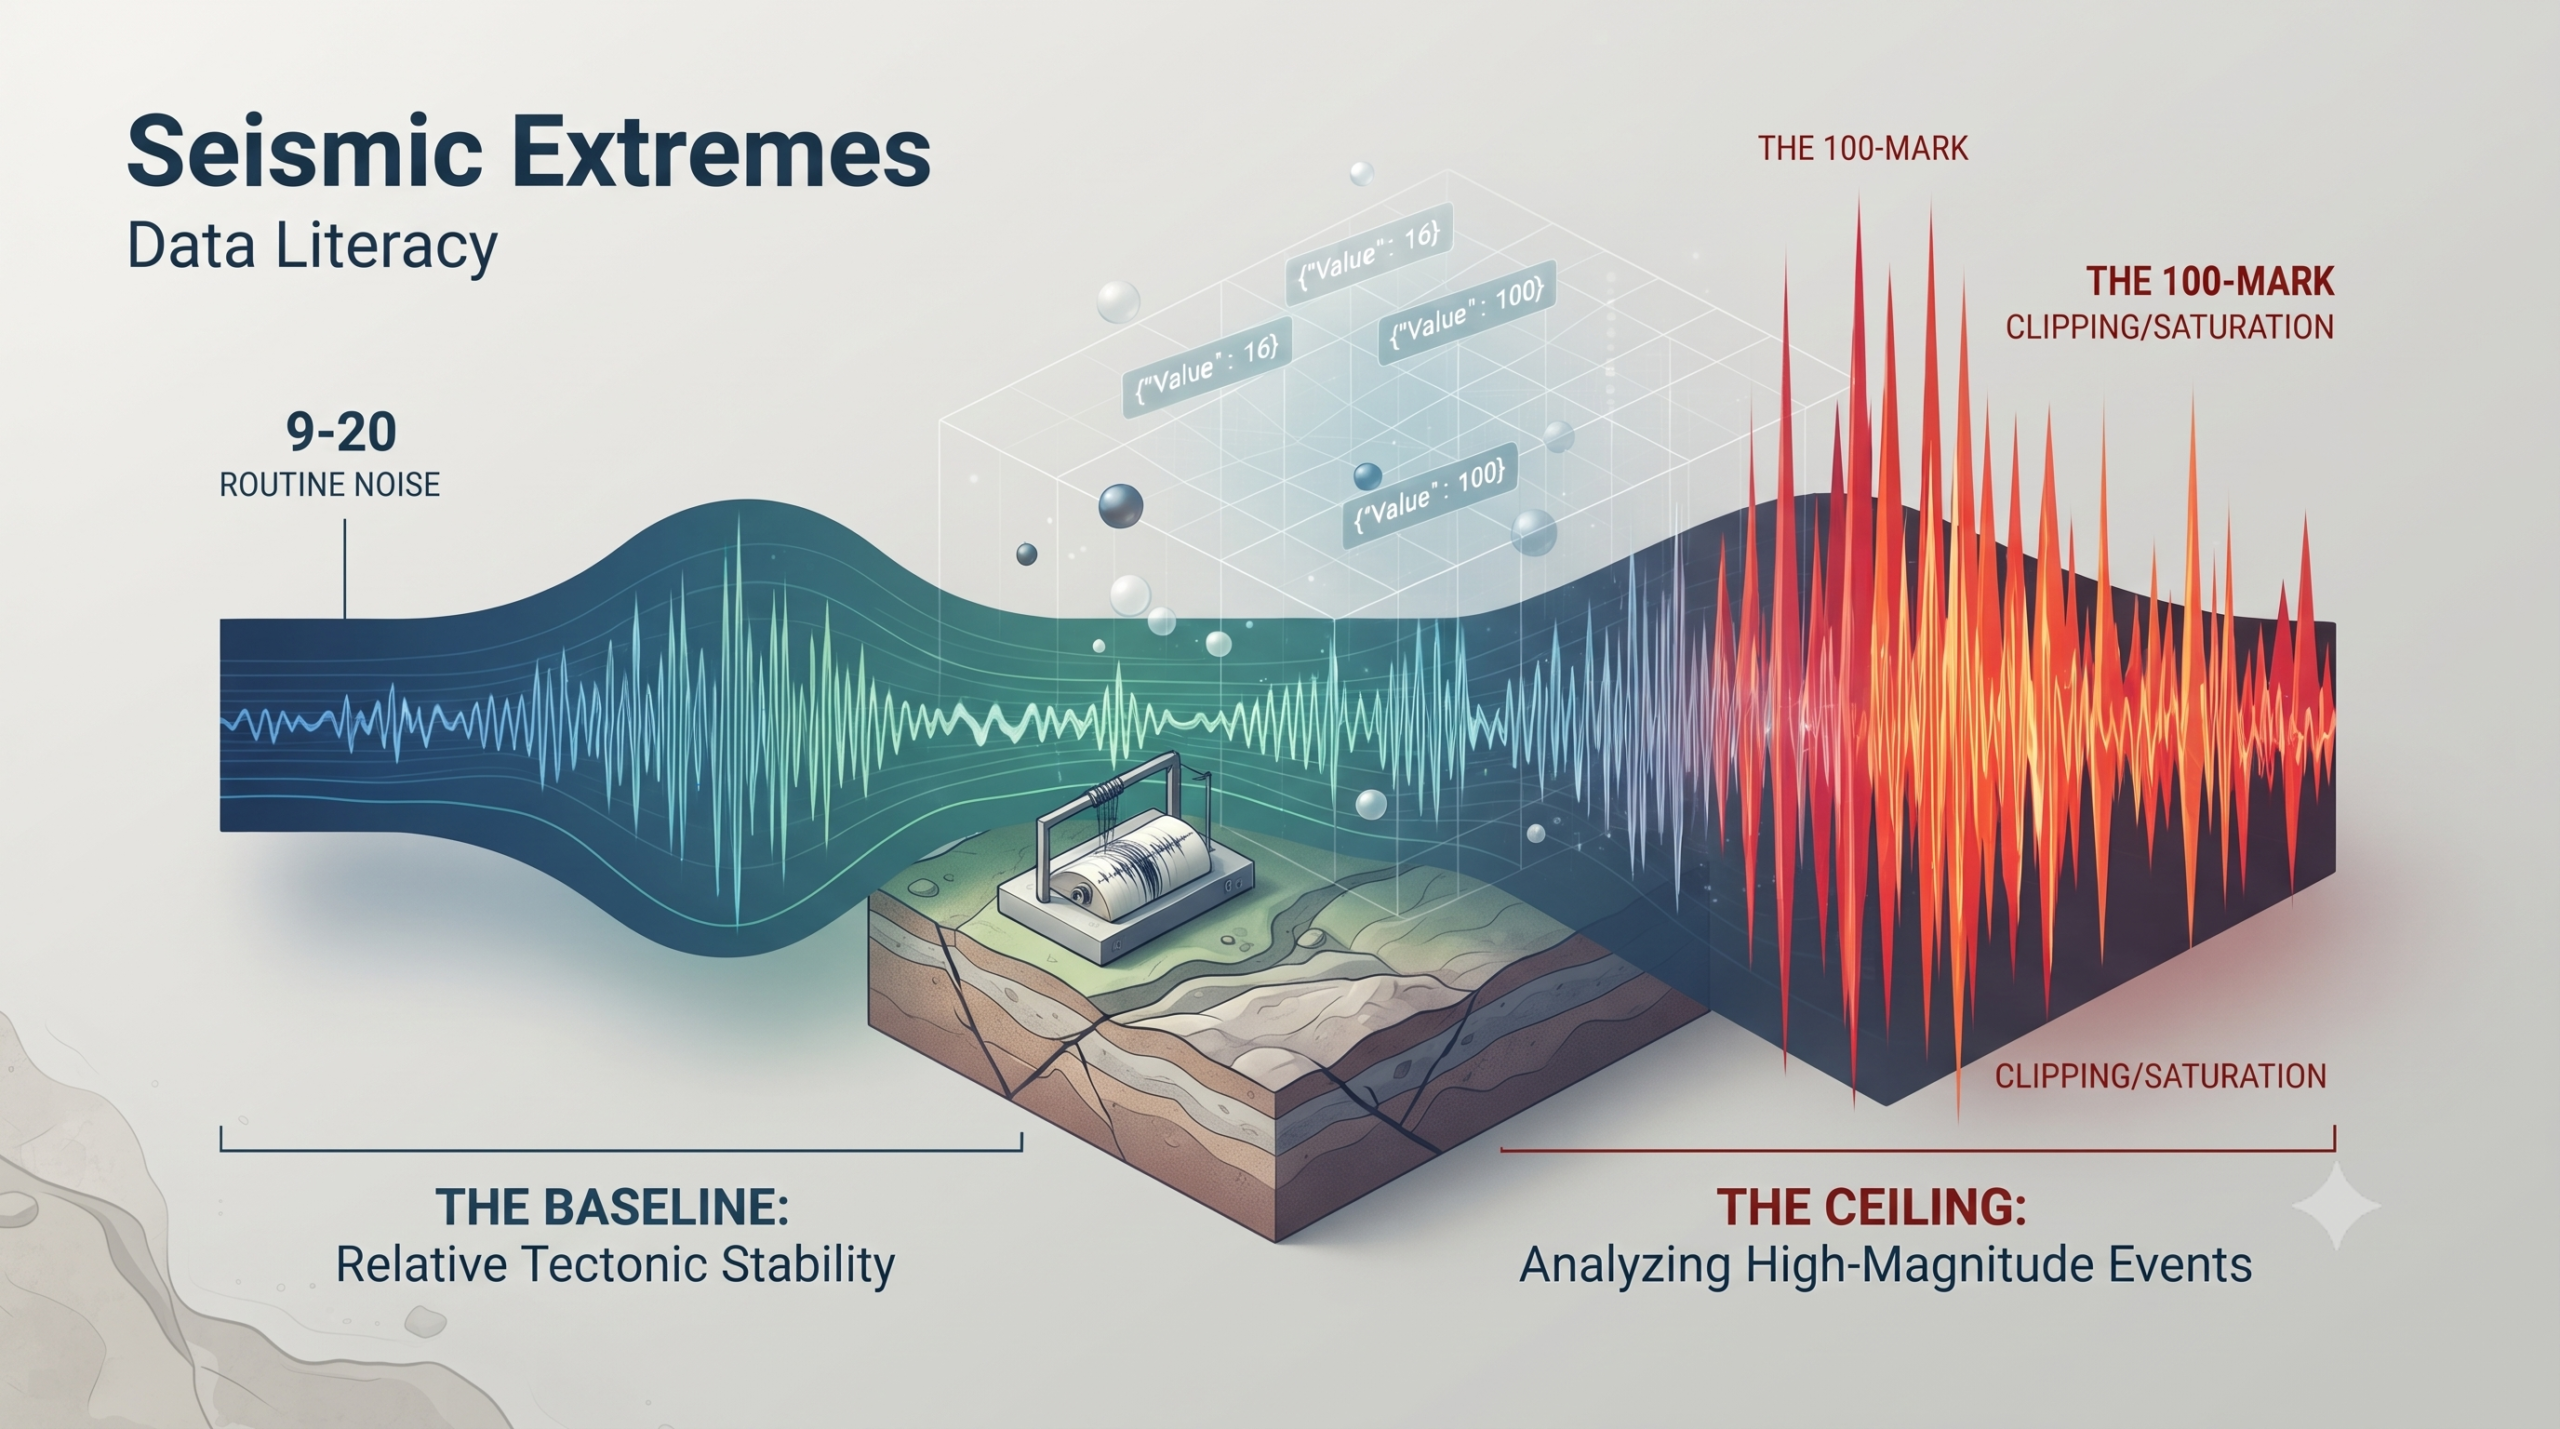
1. Introduction: Decoding the Seismic Pulse
In geological seismic data literacy, numbers are the sensory organs through which we feel the Earth’s movement. For a student of geology, the ability to differentiate between routine background “noise” and high-magnitude pulse events is a foundational skill. This guide utilizes a longitudinal dataset—tracking Date and Seismic Value—to illustrate how we define the boundaries of tectonic activity.
The observed range in our data spans from a minimum value of 9 to a definitive ceiling of 100. Measuring this range is not merely a mathematical exercise; it is critical for geological safety and infrastructure monitoring. Significant seismic events often result from the sudden release of tectonic loading, and identifying these signals requires a firm grasp of the baseline before one can interpret the extremes.
2. Defining the Baseline: Low-Range Activity
In seismic data literacy, the “baseline” represents periods of relative tectonic stability. Our dataset identifies an absolute floor of 9, occurring on dates such as 2001-12-17, 2002-07-07, and 2003-08-17. While these are the absolute minimums, a broader “routine baseline” is frequently observed in the 13–20 range.
It is important to distinguish this absolute baseline from “ambient noise.” While the Earth is quietest at 9–20, active periods often see ambient tremors fluctuate between 40 and 60. Understanding these levels allows analysts to recognize when the Earth is returning to a state of equilibrium.
The Baseline: Representative Low-Value Entries
| Date | Seismic Value | Description |
|---|---|---|
| 2001-12-17 | 9 | Absolute Minimum Value |
| 2002-07-07 | 9 | Absolute Minimum Value |
| 2003-08-17 | 9 | Absolute Minimum Value |
| 2000-04-10 | 13 | Routine Baseline Entry |
| 2001-09-27 | 13 | Routine Baseline Entry |
| 2003-04-28 | 13 | Routine Baseline Entry |
These low values are the foundation of data analysis because they provide the necessary contrast required to identify anomalies. Without a confirmed baseline, a high value has no context. Once we establish these quiet moments, we can begin to evaluate the significance of signals that break toward the extreme.
3. The Ceiling: Analyzing the 100-Mark Events
At the opposite end of the spectrum lies the value of 100. In this specific dataset, 100 functions as a statistical ceiling. From a data literacy perspective, this suggests signal saturation or clipping—a scenario where the seismic energy likely meets or exceeds the sensor’s maximum recording threshold or a pre-defined magnitude limit.
Types of Extremes
- The Singular Spike
- Example: 2001-03-16 (Value: 100).
- So What? An isolated 100-mark day, surrounded by moderate values (e.g., the 40s), represents a sharp, immediate release of energy. While noteworthy, it lacks the systemic implications of a cluster.
- The Sustained Sequence
- Example: December 26, 2004, to December 31, 2004.
- So What? A continuous string of 100s over six days indicates a major geological adjustment. Such sequences are far more significant than spikes as they represent a prolonged period of high-intensity energy discharge.
- The Massive Cluster
- Example: March 11, 2011, through April 8, 2011.
- So What? This is the most severe category. This massive cluster spans nearly a month of “clipped” maximum values. It indicates a catastrophic event followed by a complex aftershock sequence, fundamentally altering the geological narrative of the region.
The frequency of these 100s serves as a primary indicator of whether we are viewing a localized tremor or a systemic tectonic shift.
4. Comparative Analysis: Baseline vs. Extreme
A tenfold increase exists between our absolute minimum (9) and our ceiling (100). However, a senior analyst looks beyond the peaks to see how the “floor” moves during active periods.
Quiet Month: February 2000
- Characteristics: Dominated by low-to-moderate background energy.
- Key Data Points: February 1 (16), February 5 (20), February 11 (20).
- Conclusion: This month represents a stable geological state where values rarely deviate from the baseline.
Active Month: November 2006
- Characteristics: High-intensity clusters where the baseline itself has shifted upward.
- Key Data Points: Multiple strings of 100s (Nov 7–9, 15–20, 22–24).
- Conclusion: In this month, the “quiet” days rarely drop below 40. This upward baseline shift indicates a state of high tectonic stress where even the lulls are more active than a standard “quiet” month.
Critical Takeaways for Data Identification
- Intensity and Clipping: A value of 100 should be interpreted as a potential sensor limit; the actual energy release could be even higher.
- Systemic Shifts: Look for months like November 2006 where the minimum values are significantly higher than the standard baseline of ~20; this suggests a period of ongoing instability.
- The “Ambient” Context: While 100 is a tenfold jump from the absolute floor, it is often only a doubling of the active “ambient noise” (50). True “significance” is found in how long the 100 is sustained.
By synthesizing these comparisons, we can establish a rigorous evaluation protocol for any new seismic entry.
5. Student Summary: The Seismic Identification Checklist
Use this checklist to evaluate new data entries and determine their geological significance:
- [ ] Is the value at the 100-mark ceiling? (Indicates potential signal saturation/peak activity).
- [ ] Is the value within the routine baseline (9–20)? (Indicates standard geological silence).
- [ ] Is the entry part of a chronological cluster? (Three or more days of high values signify a sustained event).
- [ ] Has the local baseline shifted? (Check if the “quiet” days in the month are staying above 40).
- [ ] Is it a singular spike? (Check if surrounding dates return immediately to the 20–40 range).
Mastering these numerical relationships allows you to move beyond simple observation and begin to truly “read” the Earth’s activity. Through the lens of data, even a silent string of numbers can tell a story of immense tectonic power.