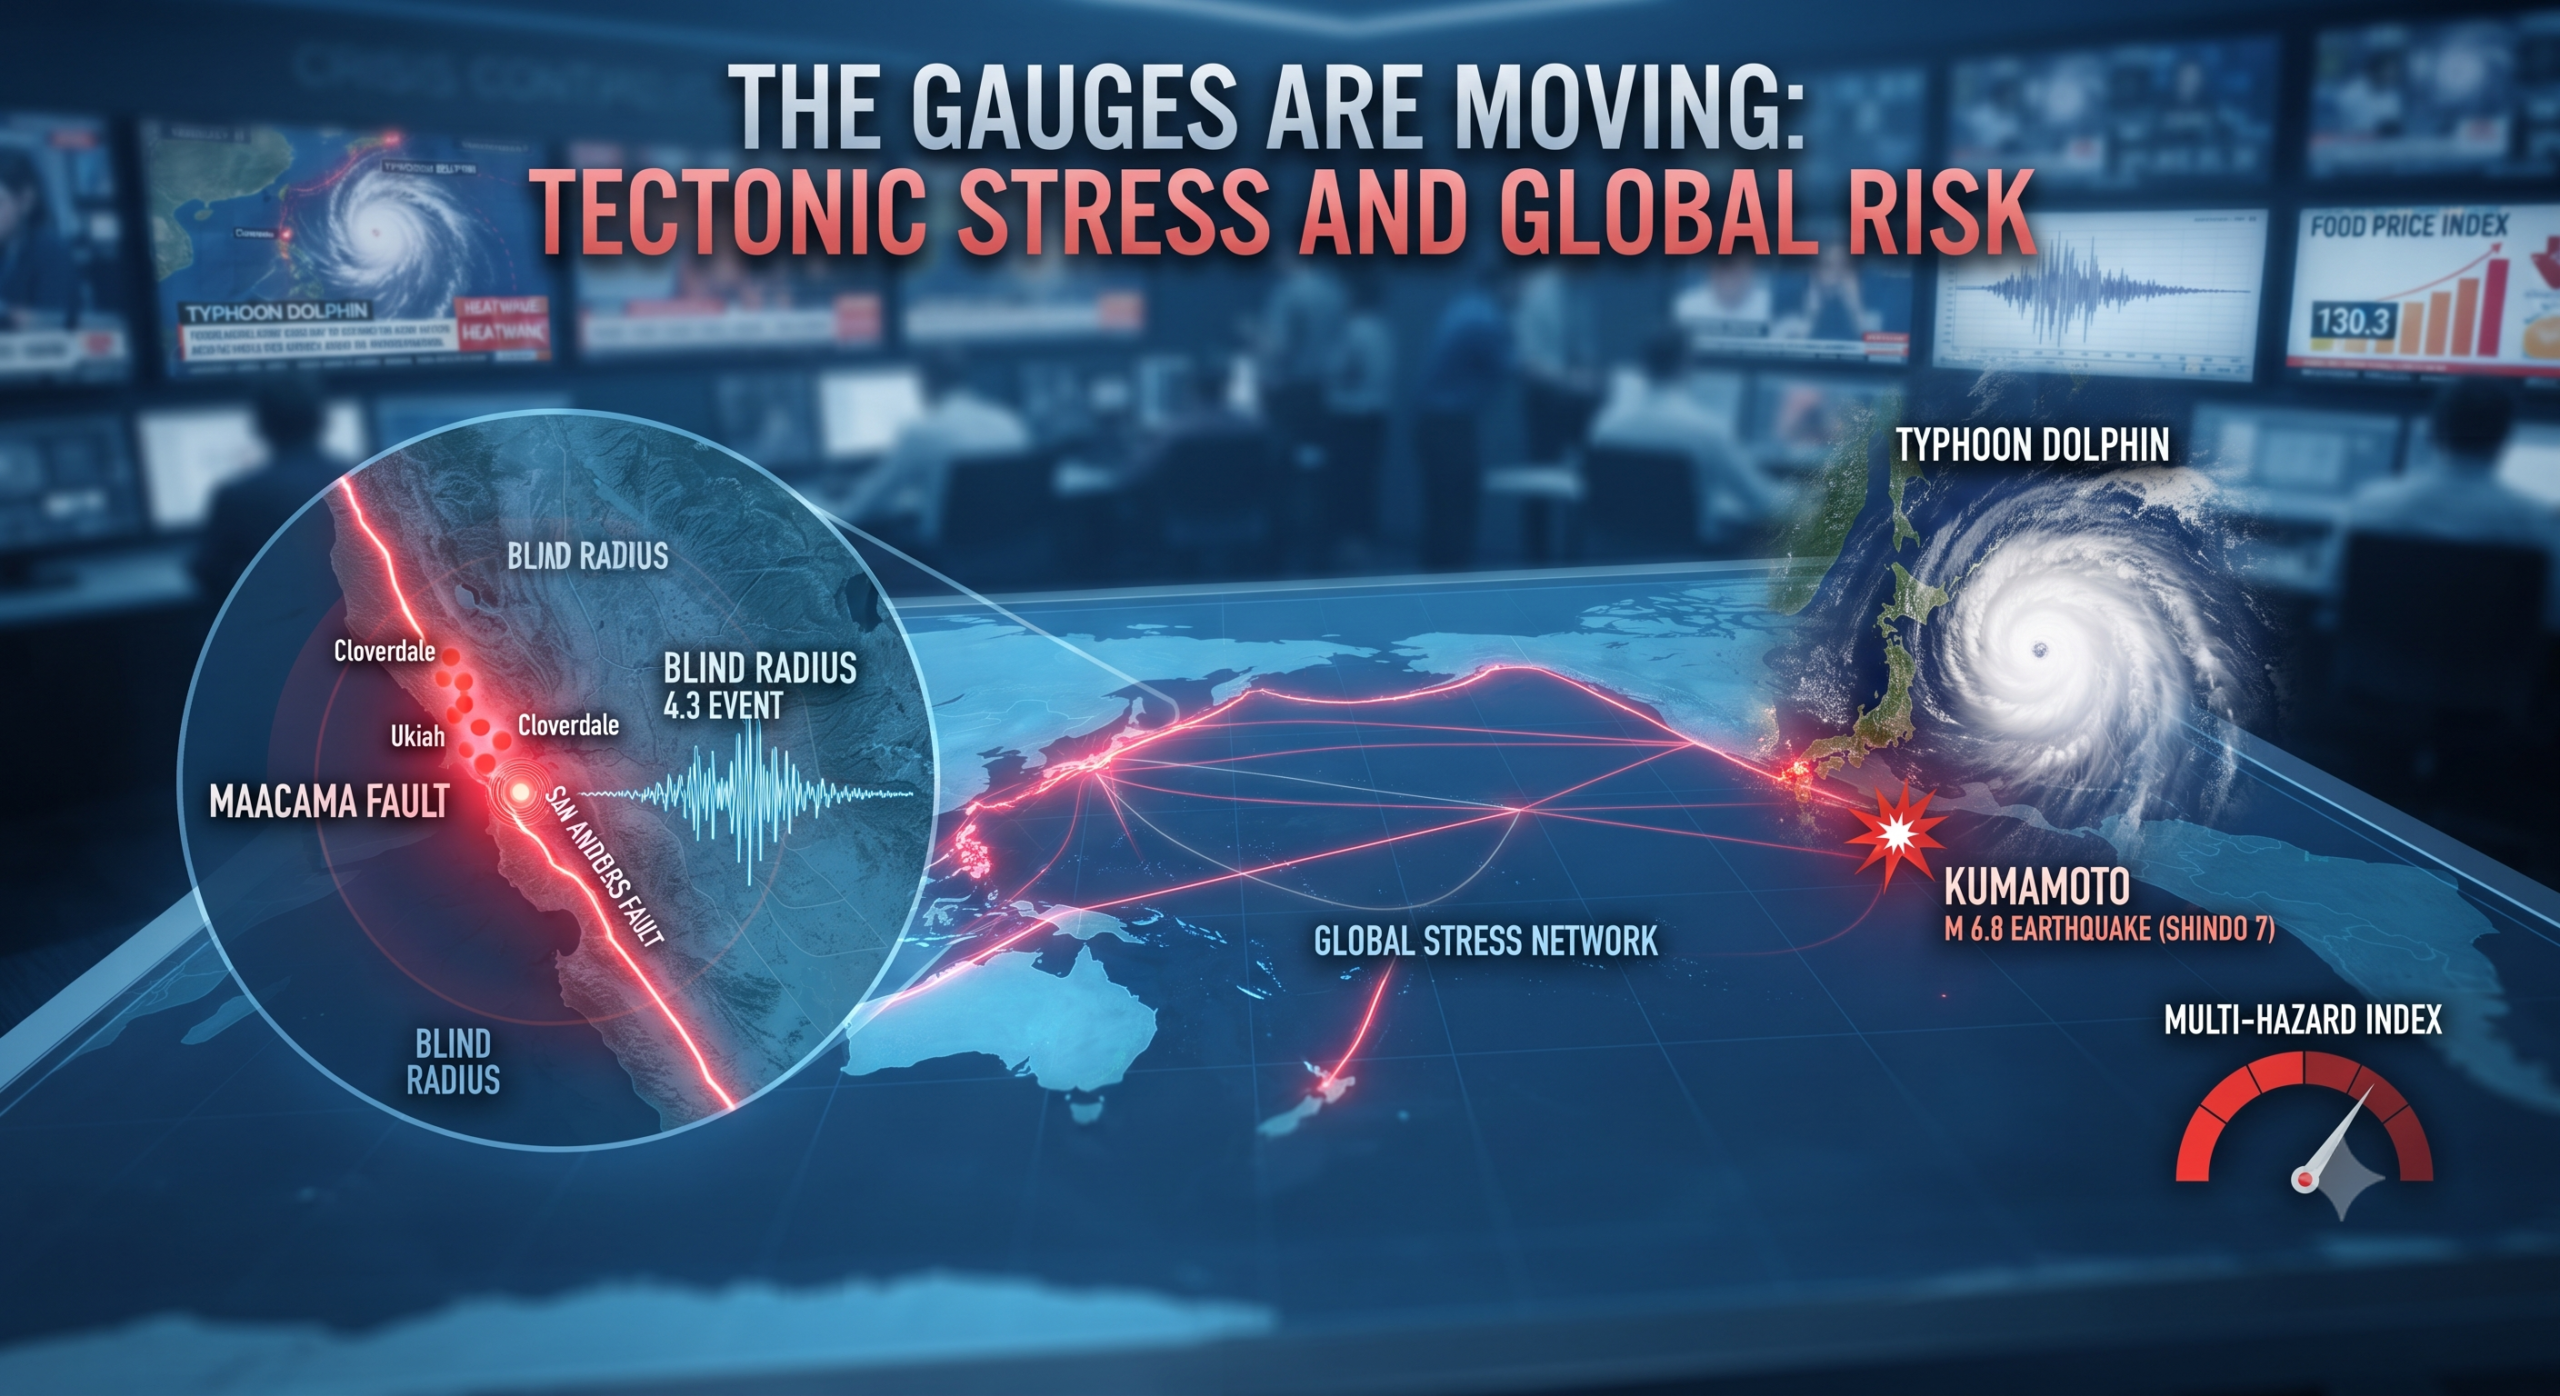
The Pacific Plate is Ringing: Why a Quiet Week in California is the Real Warning Signal 1. The Gauges are Moving Tectonic stress and global risk are rarely viewed in
Why Kumamoto Failed the 2026 PredictionsWhy Kumamoto Failed the 2026 Predictions
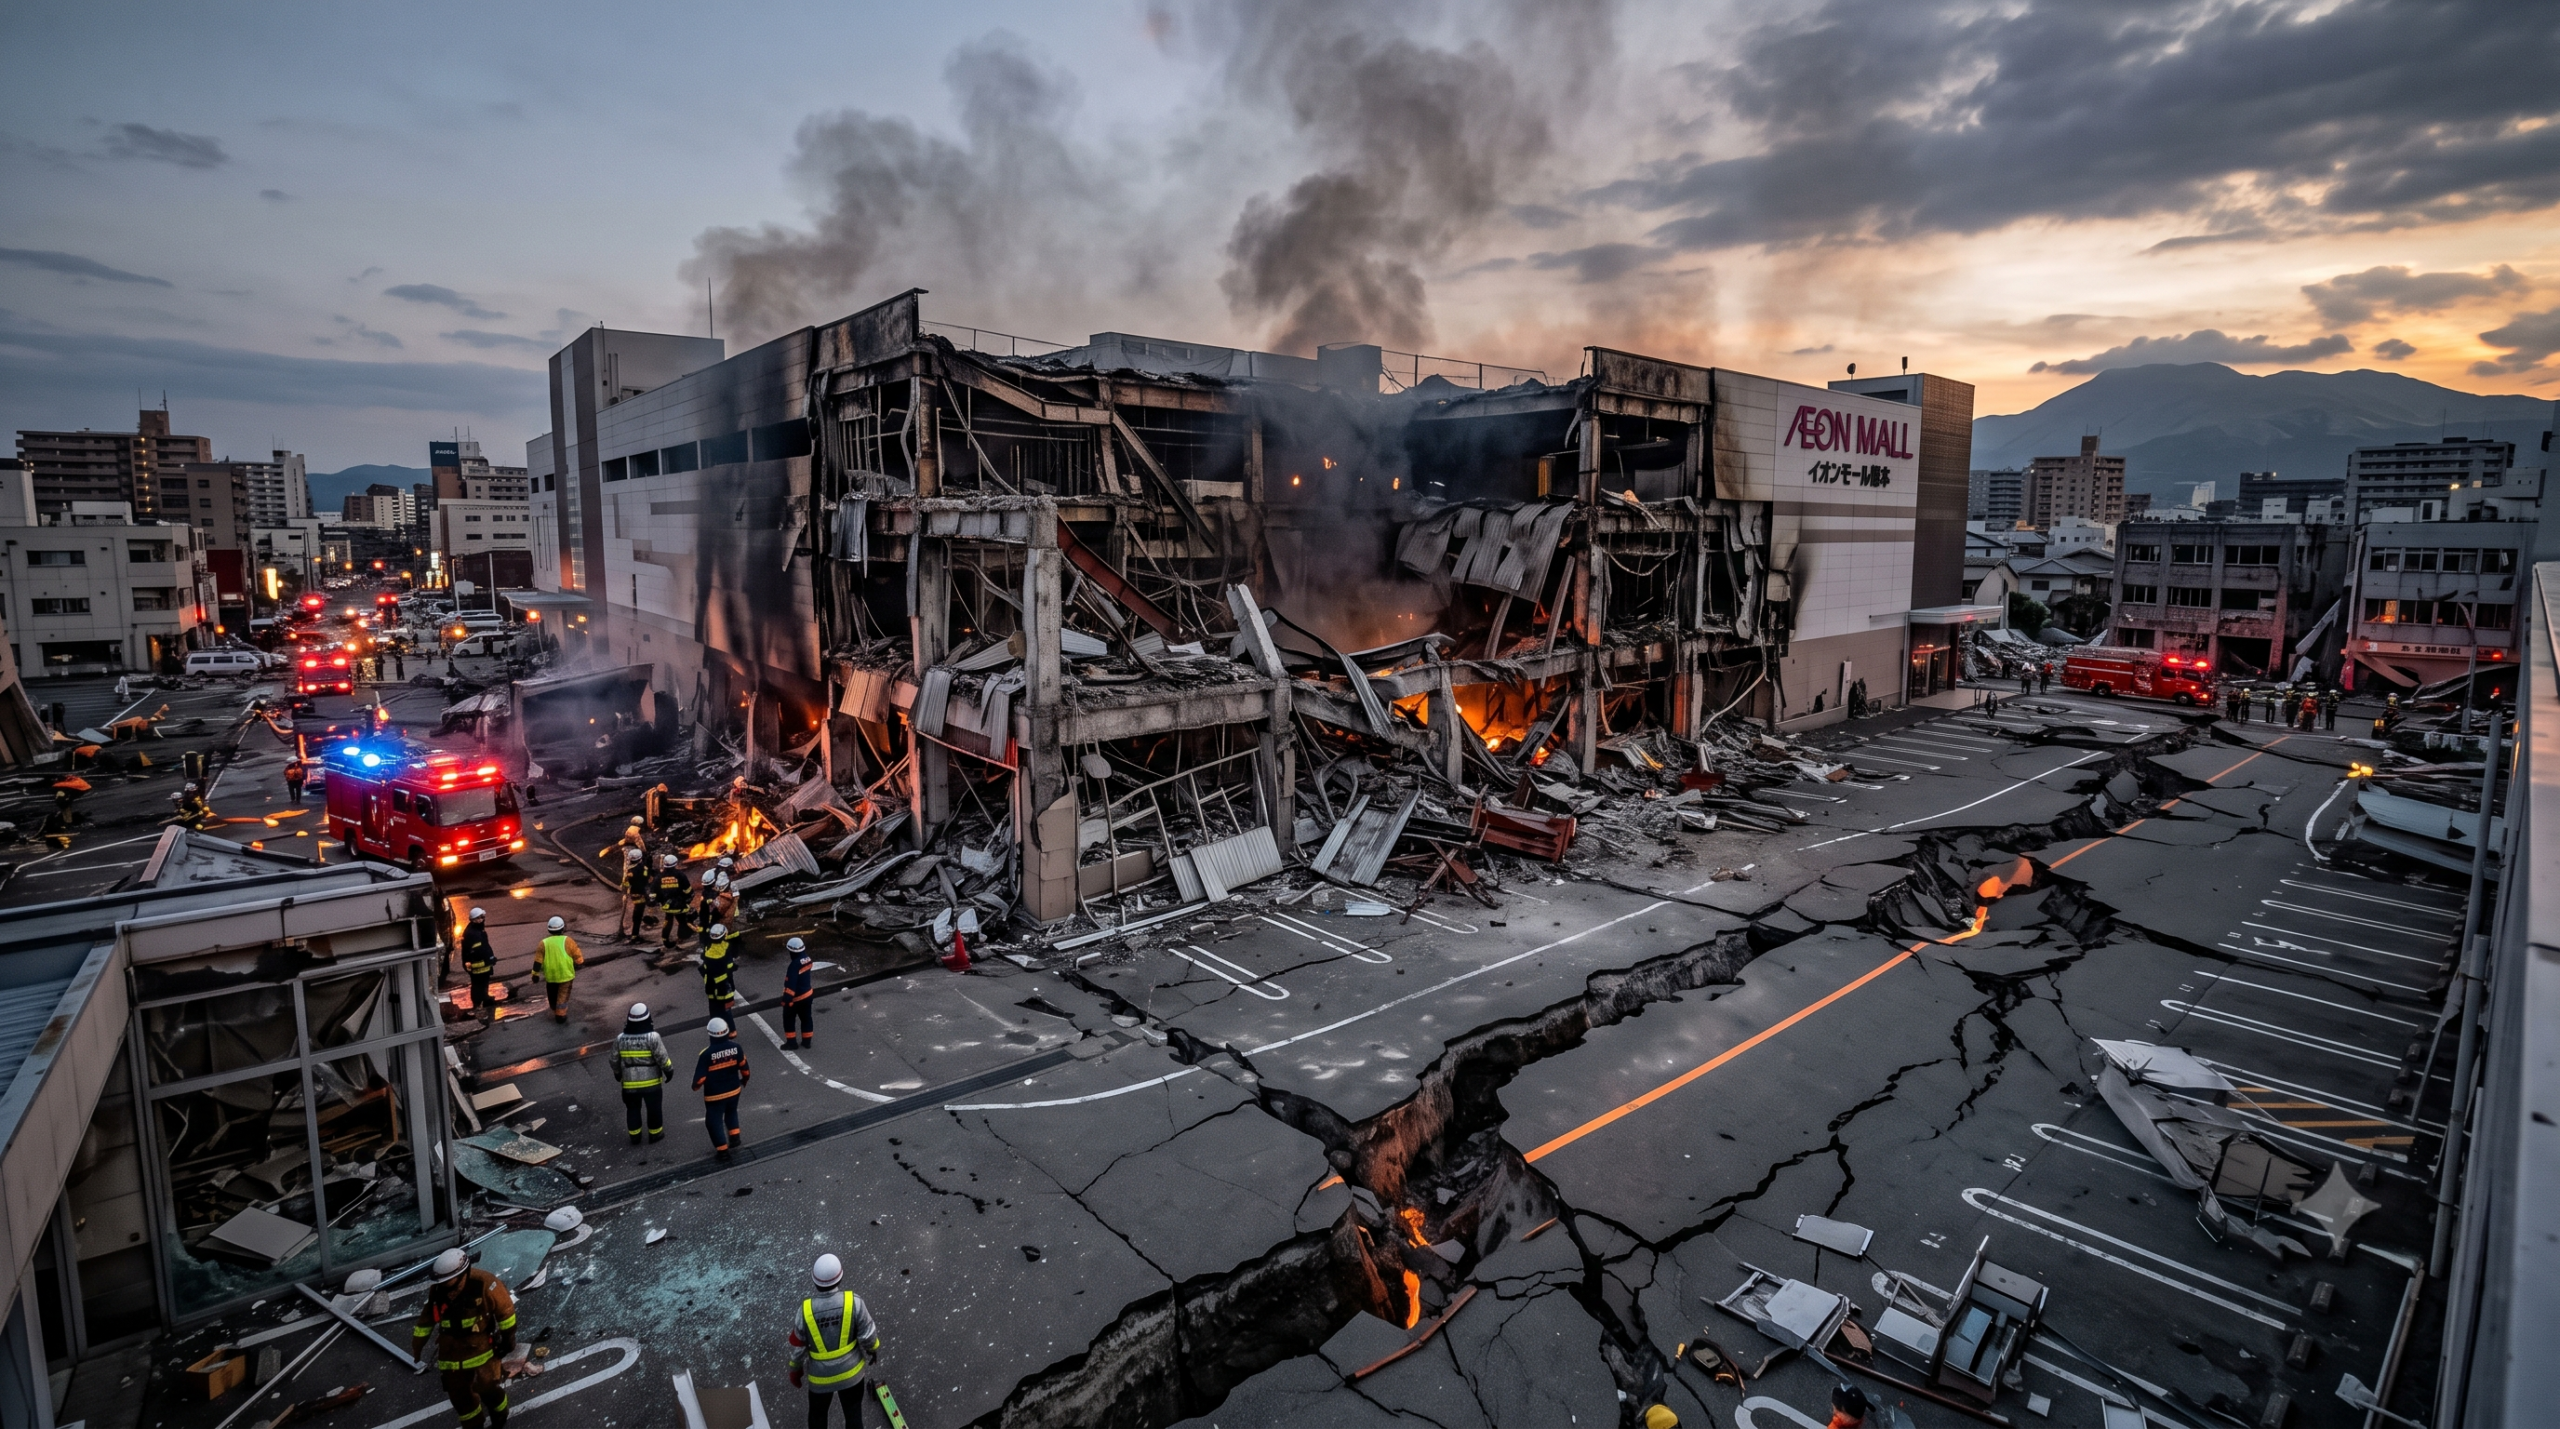
The 10-Year Echo: Why Japan’s ‘God-Tier’ Engineering Failed the Aeon Mall and What the ‘Planetary Basket’ Predicts for 2026 1. Introduction: The Sound of the Earth Ripping When evaluating Japan
Why the New Weather Reality is More Complex Than You Think: 5 Impactful Takeaways from a Summer of ExtremesWhy the New Weather Reality is More Complex Than You Think: 5 Impactful Takeaways from a Summer of Extremes
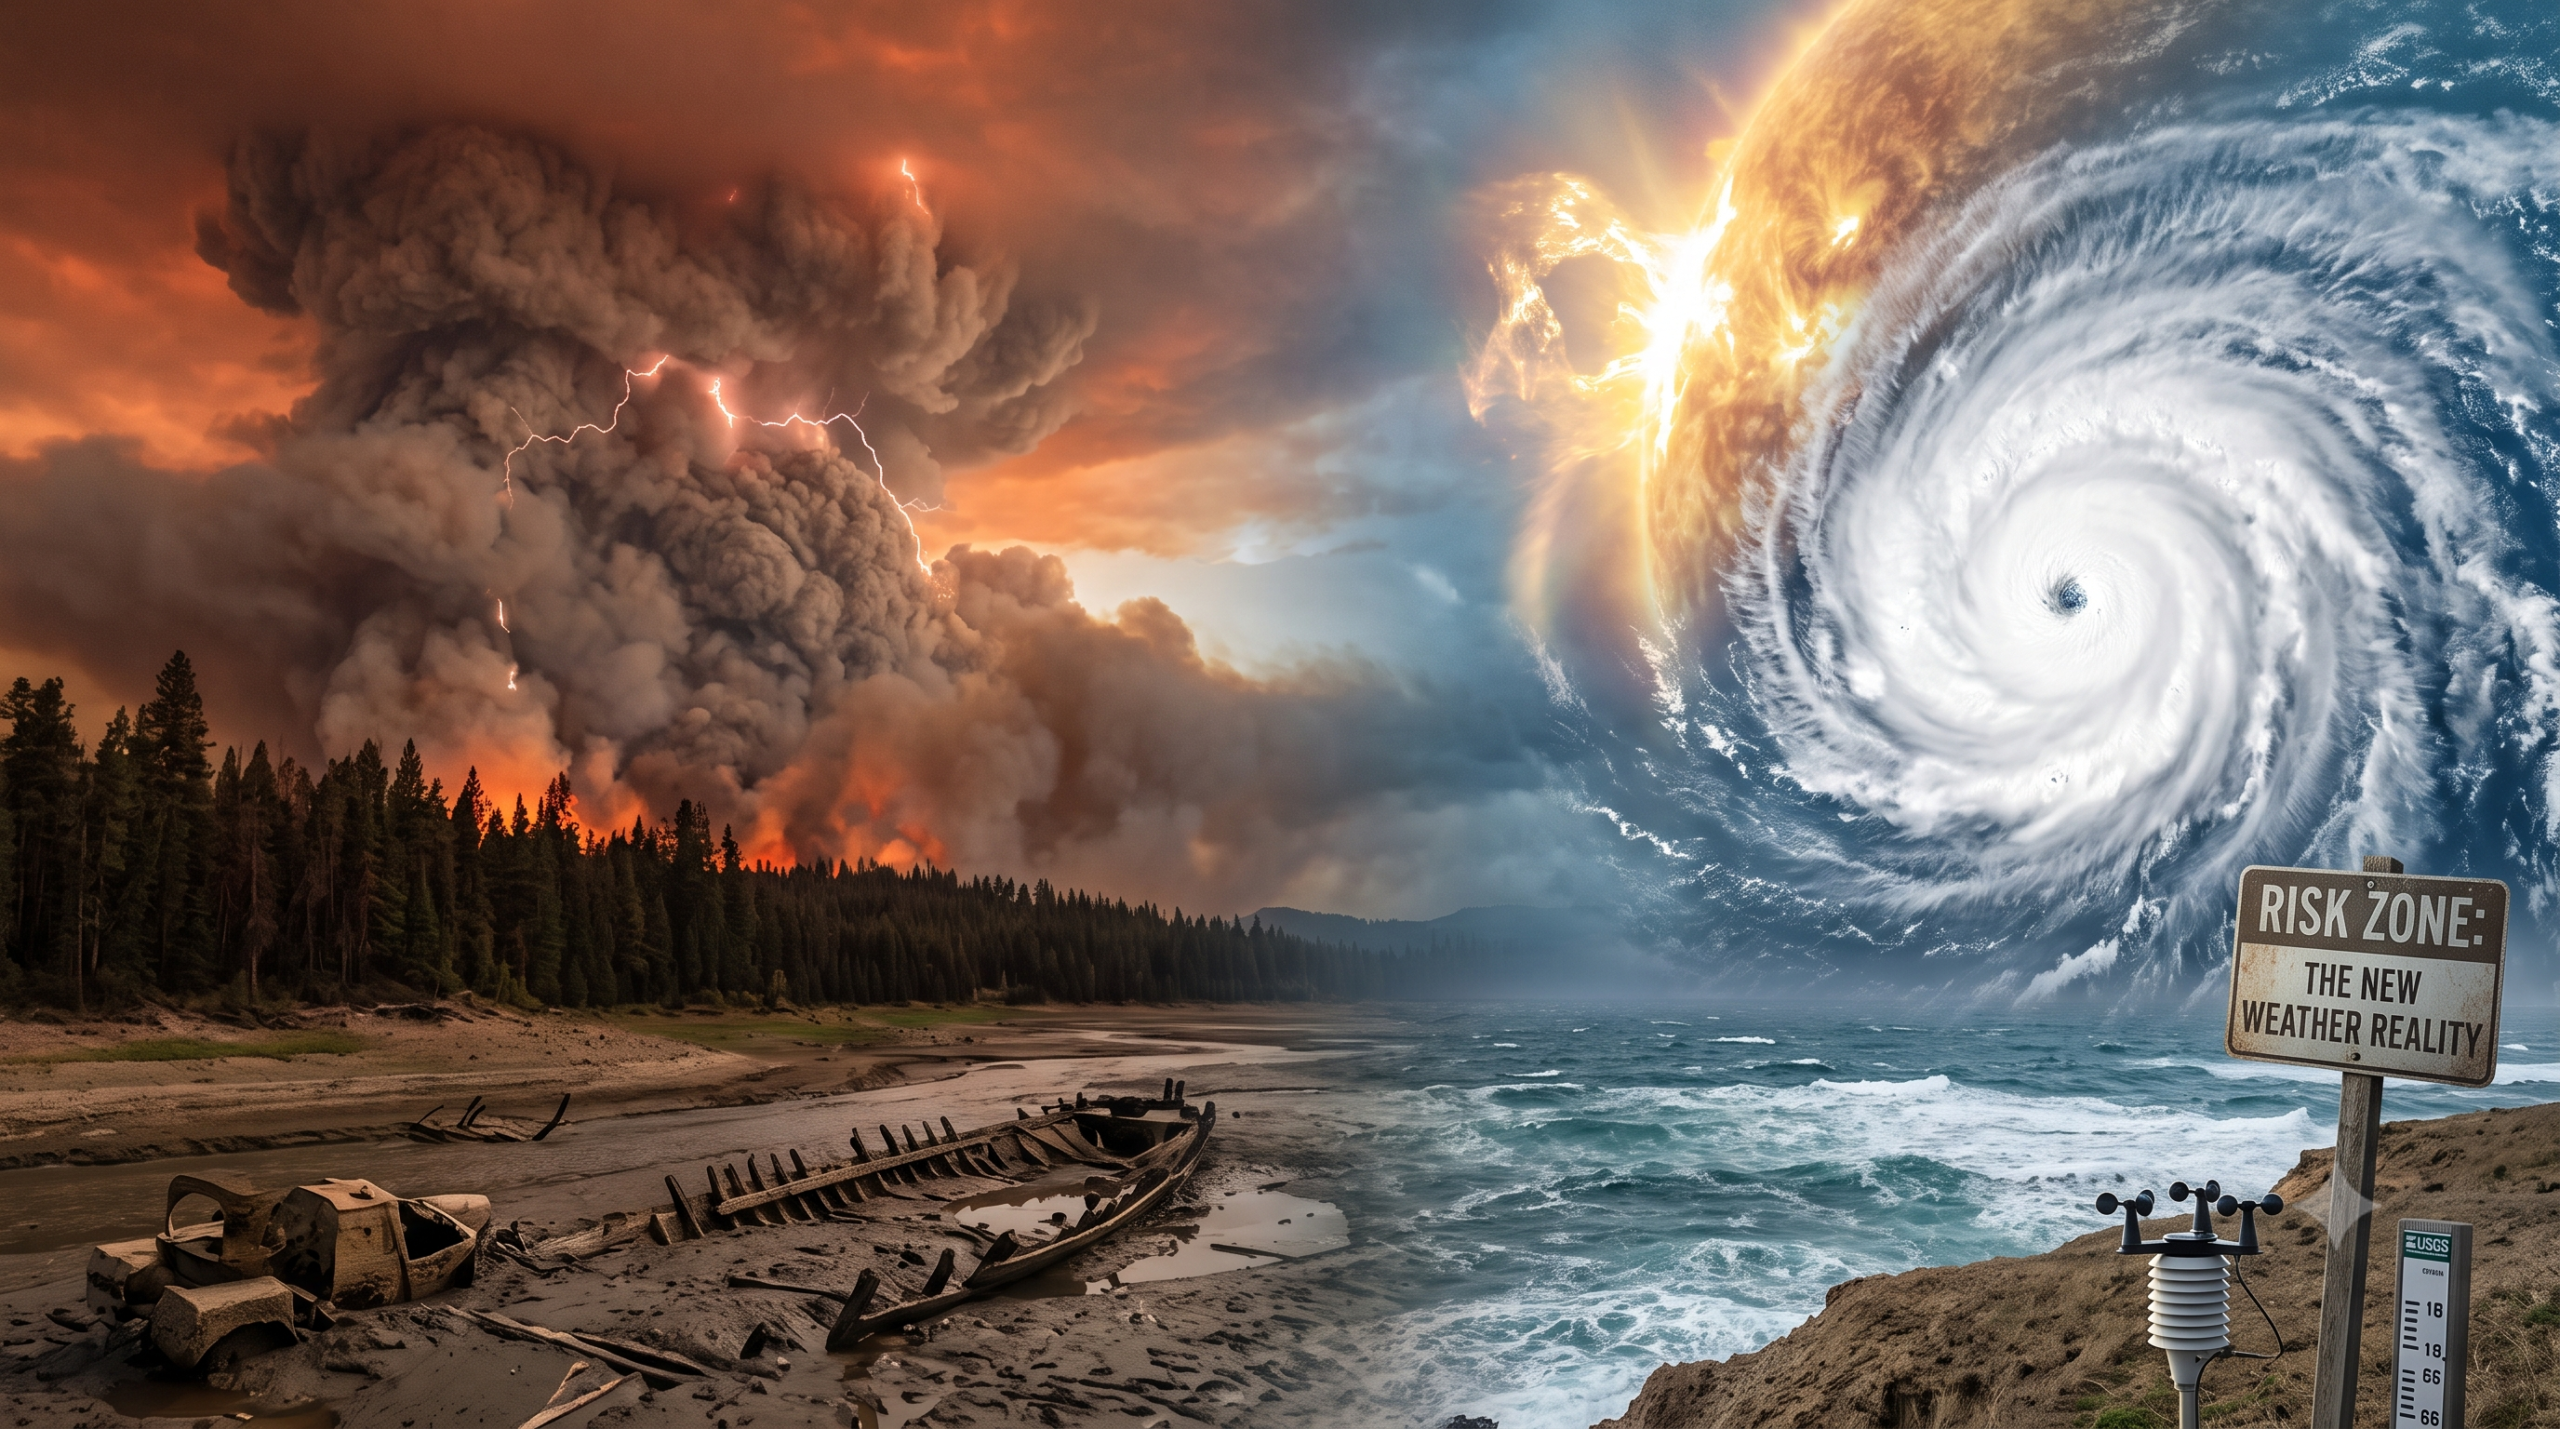
Navigating the new weather reality has moved us far beyond the realm of simple “bad seasons” and into a state of systemic volatility that scientists and officials are increasingly calling
The San Andreas “Loaded Spring”: Why California’s Noisiest Fault Zone is Whispering to Its QuietestThe San Andreas “Loaded Spring”: Why California’s Noisiest Fault Zone is Whispering to Its Quietest
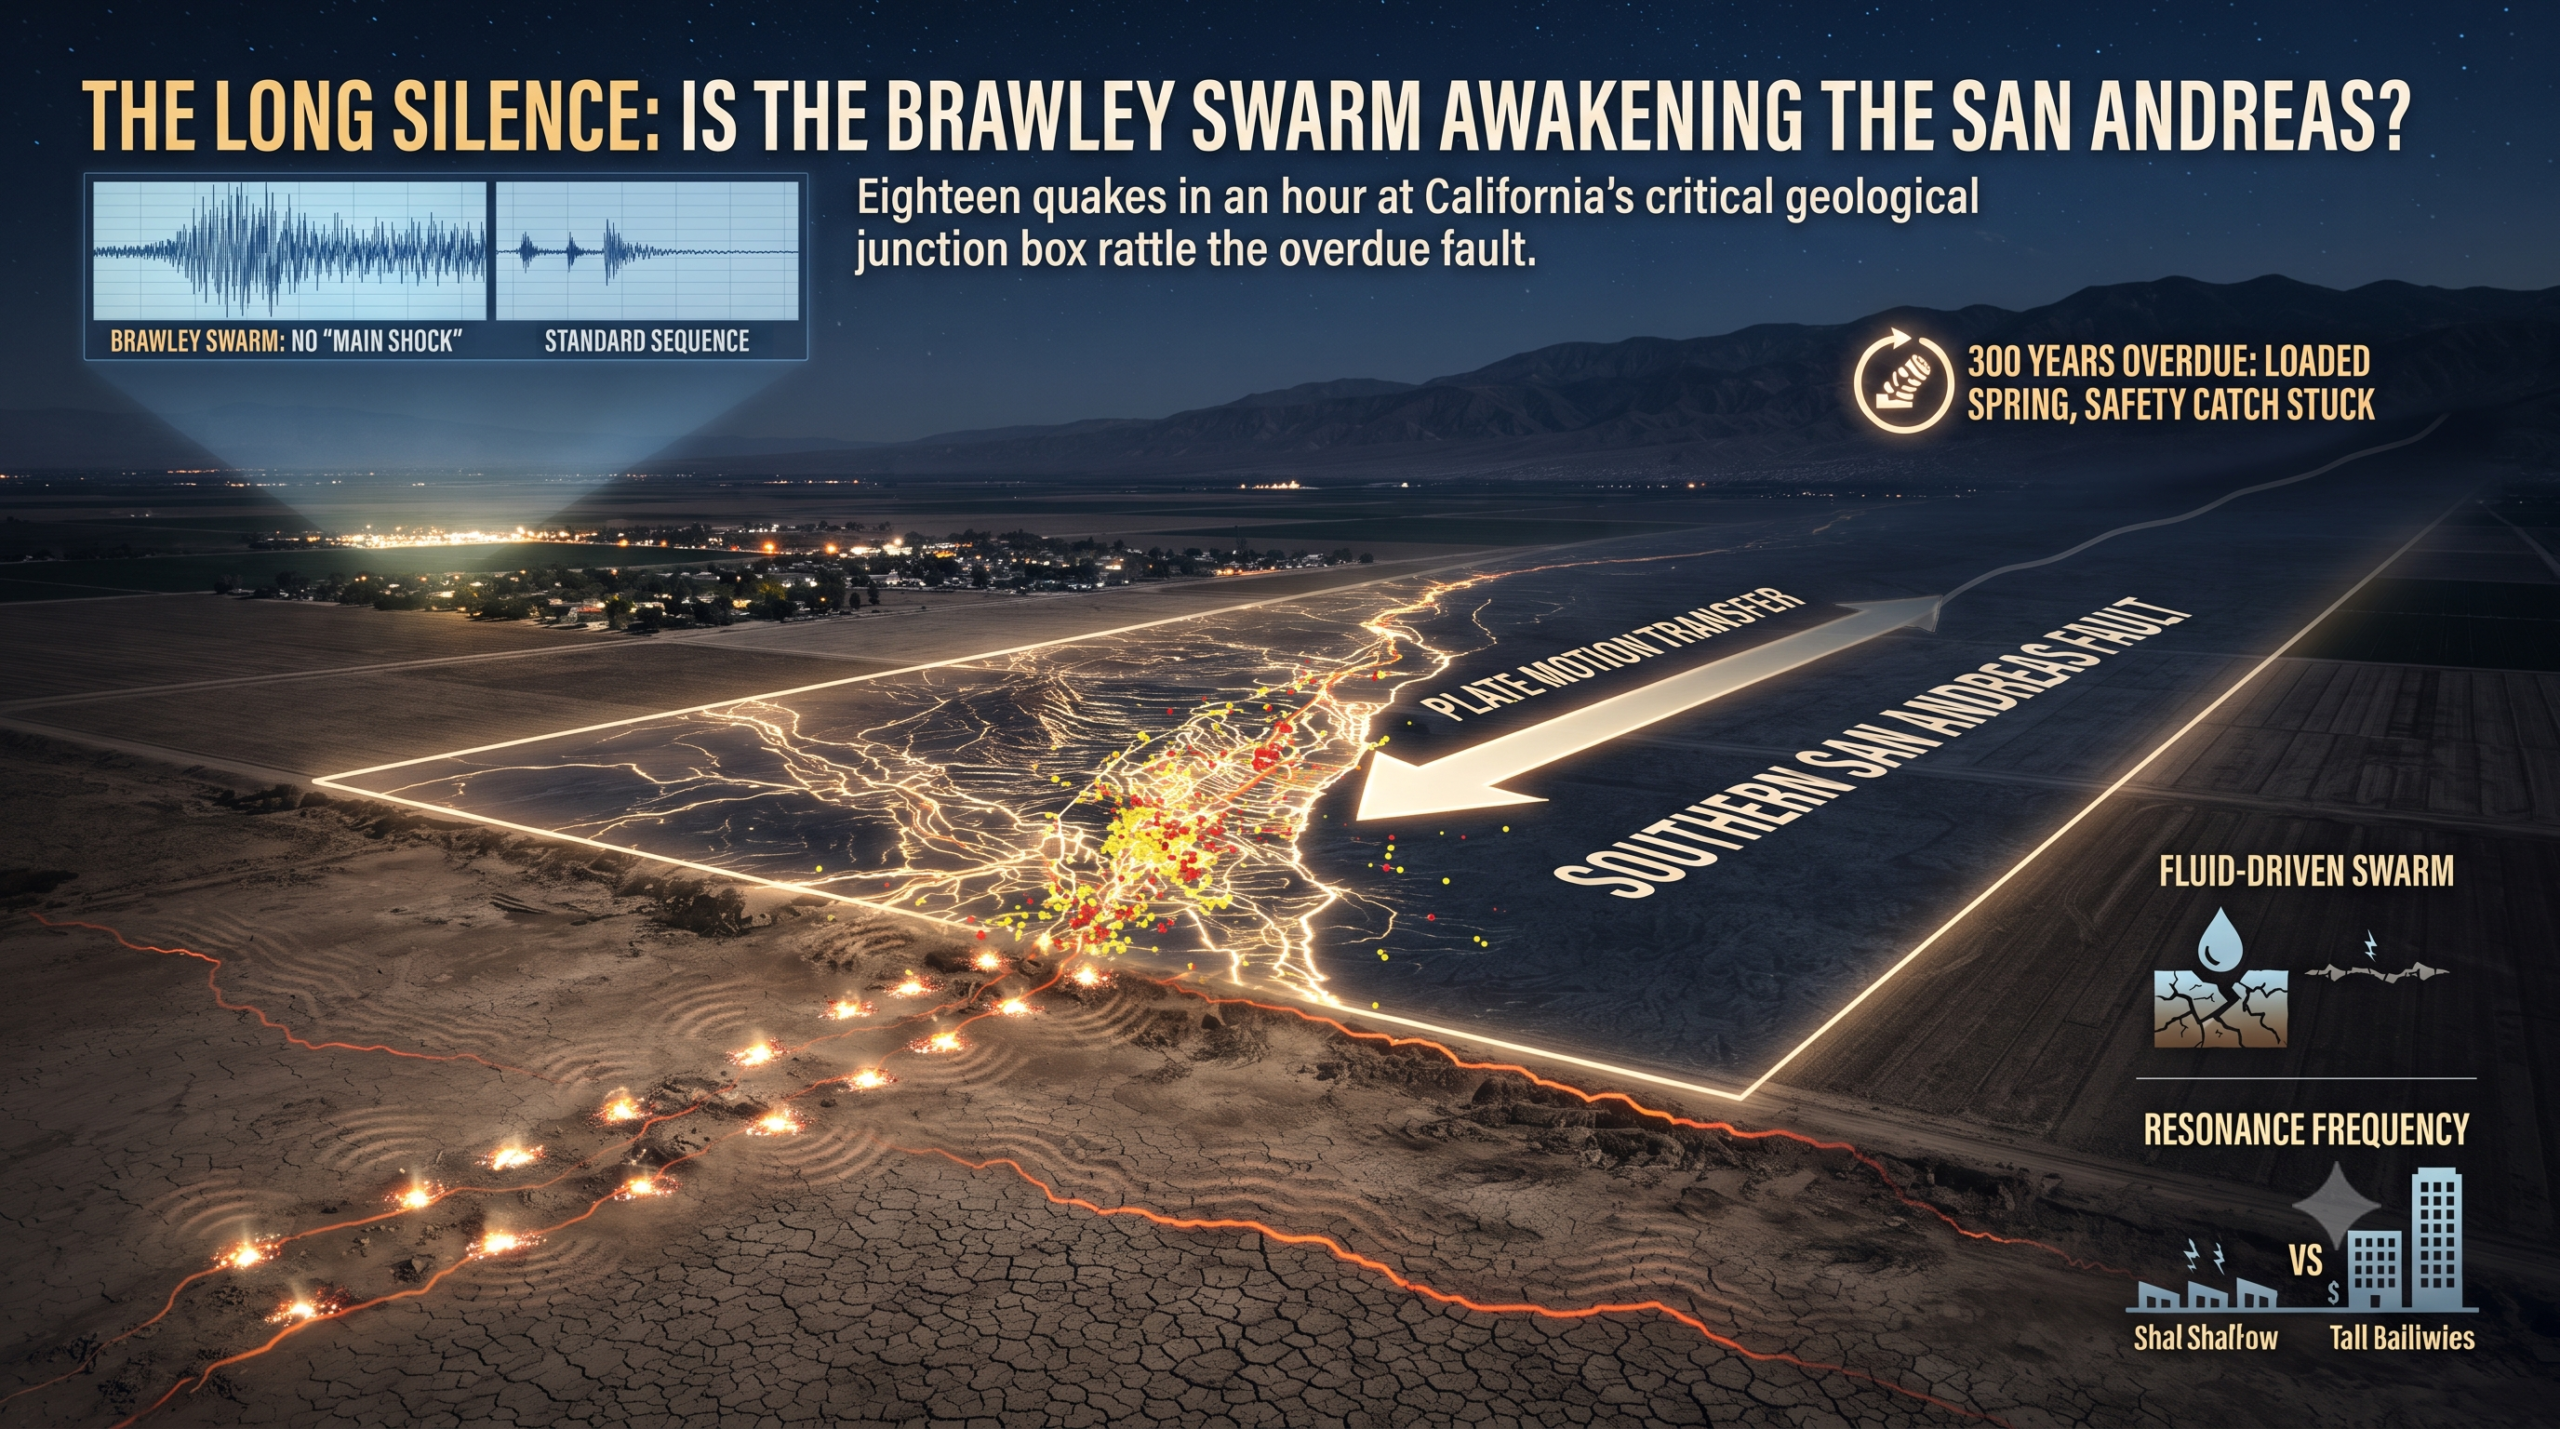
1. The Hour of Eighteen Quakes have rattled the southern doorstep of California’s most infamous fault line. Because this specific section is 300 years overdue for a major rupture, scientists
The Wicked Weather of the West: 4 Surprising Realities Behind This Week’s Global VolatilityThe Wicked Weather of the West: 4 Surprising Realities Behind This Week’s Global Volatility
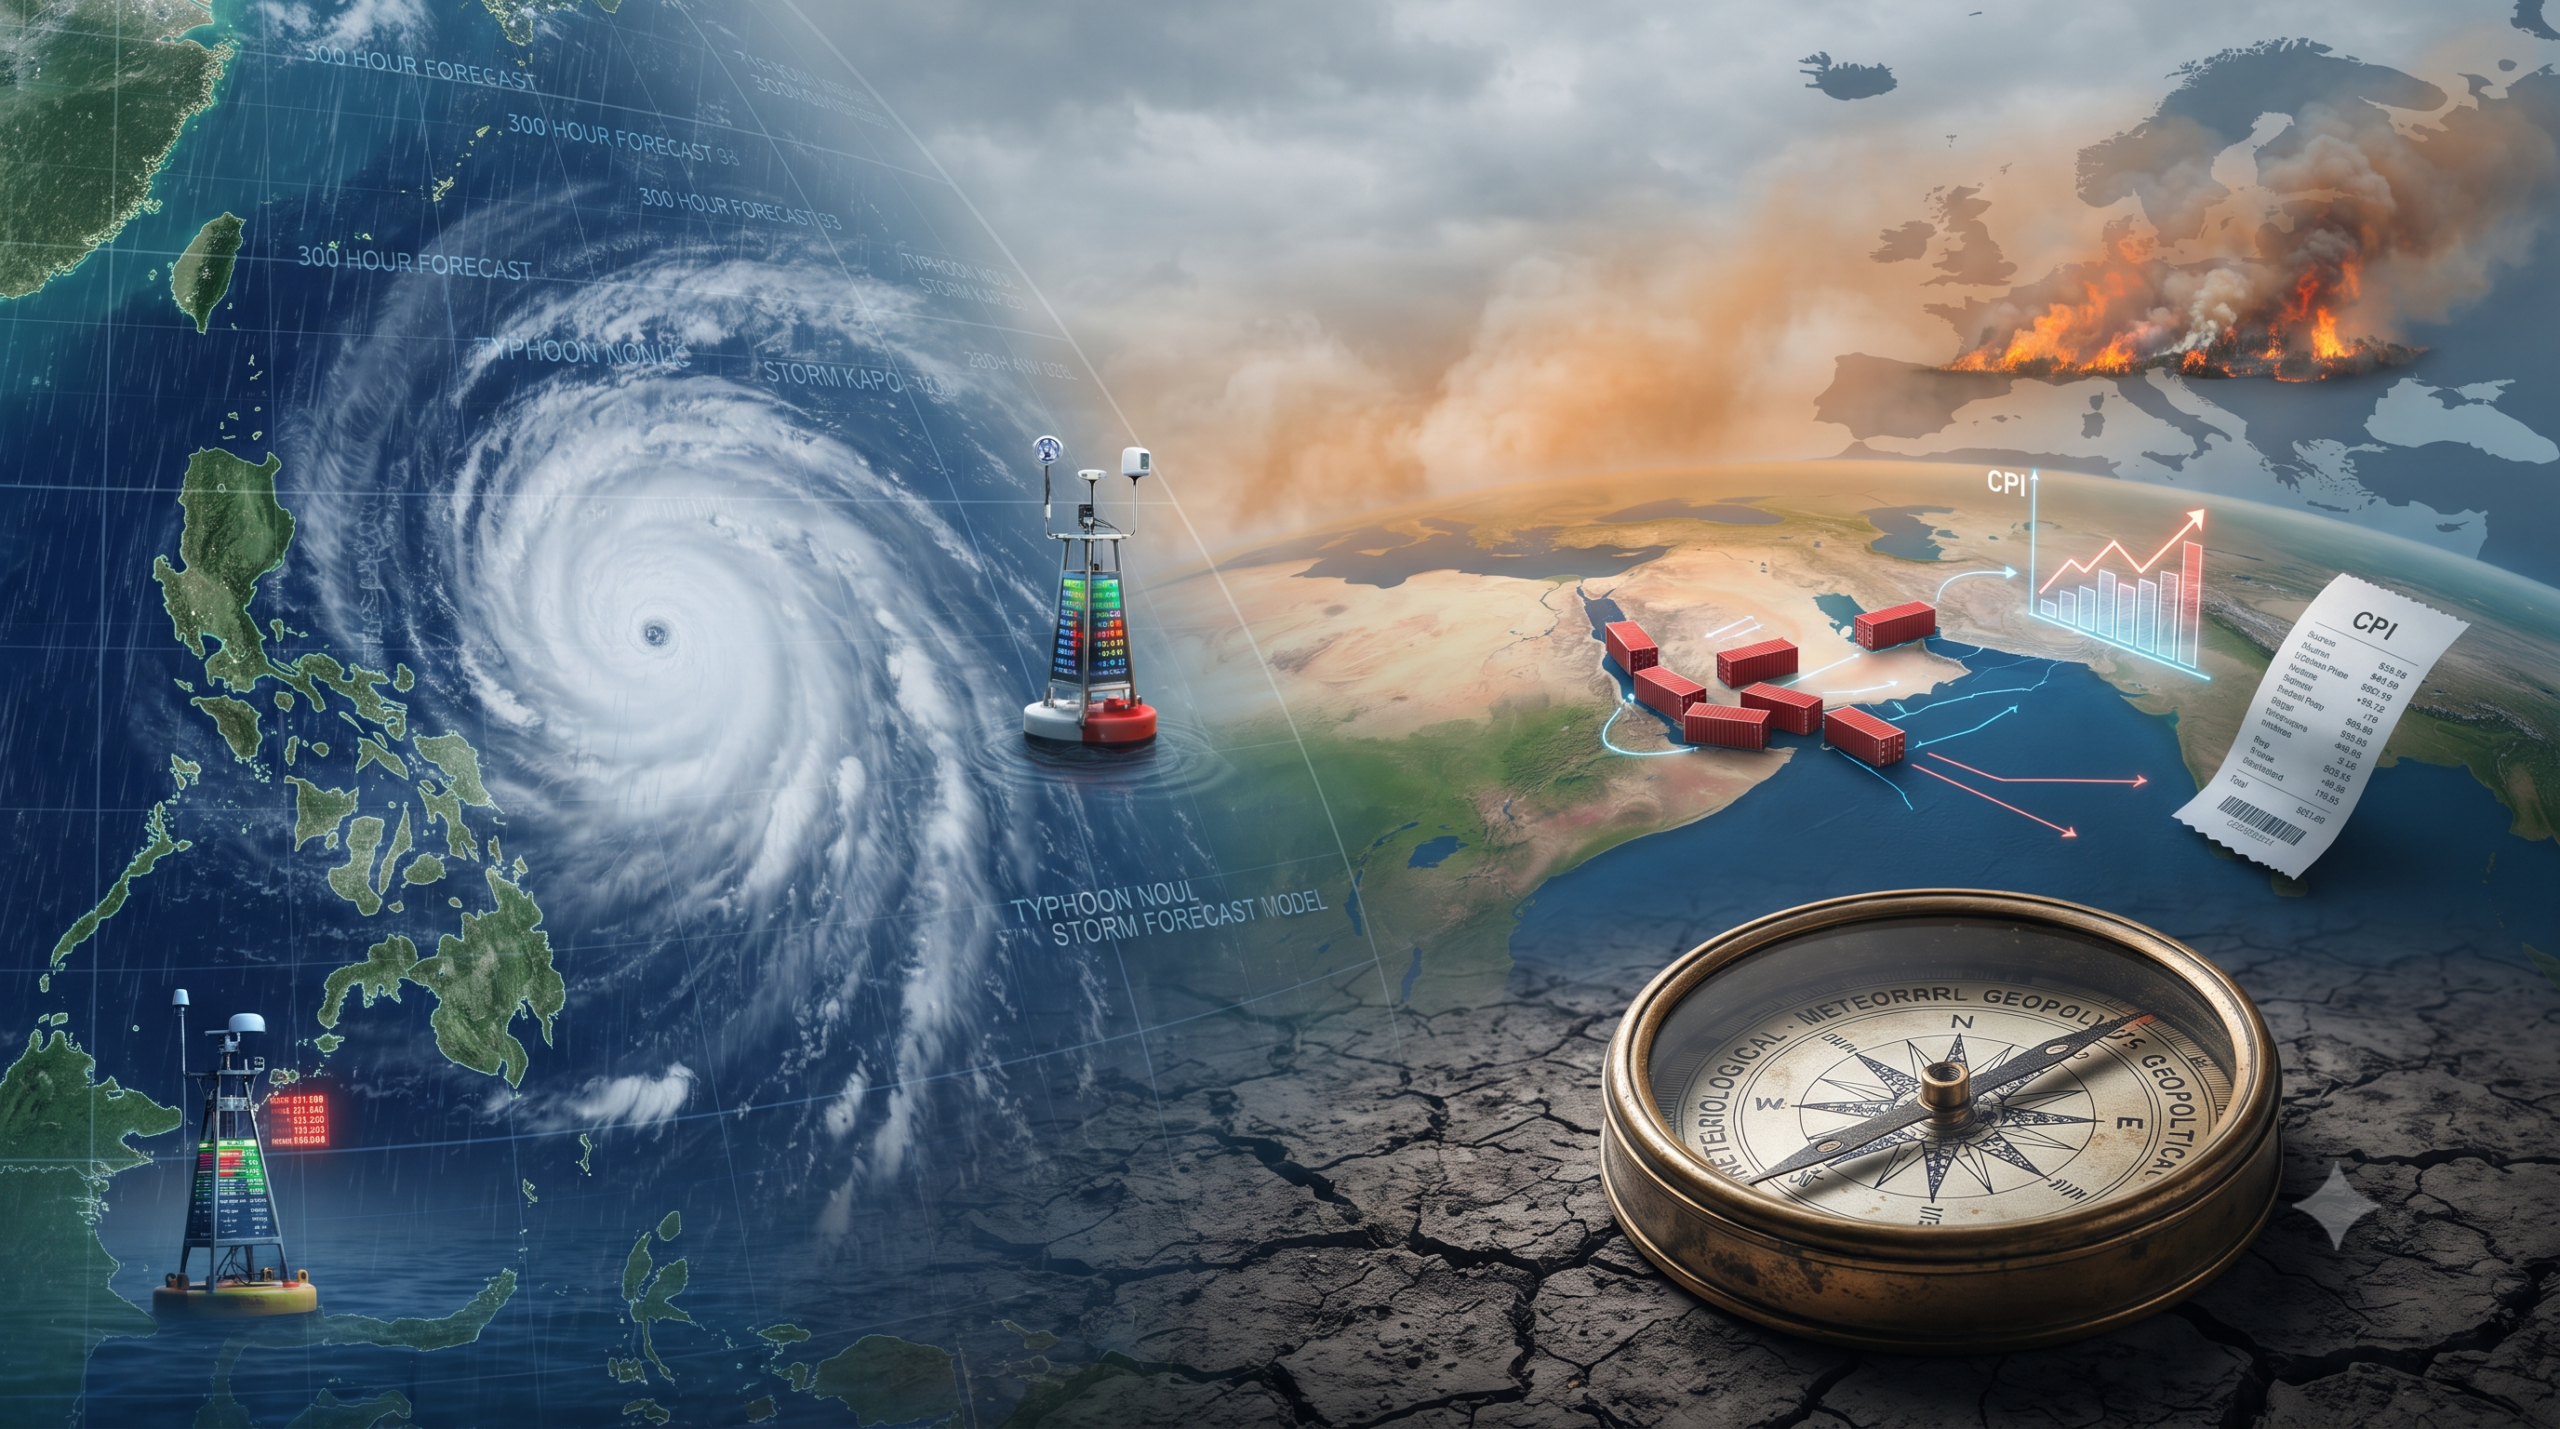
From deceptive 300-hour typhoon models to the invisible economic chain linking Red Sea blockades to your grocery bill, our world is defined by profound atmospheric and geopolitical friction. We analyze
The Invisible Threads of 2026: Why Your Grocery Bill Starts in the Strait of HormuzThe Invisible Threads of 2026: Why Your Grocery Bill Starts in the Strait of Hormuz
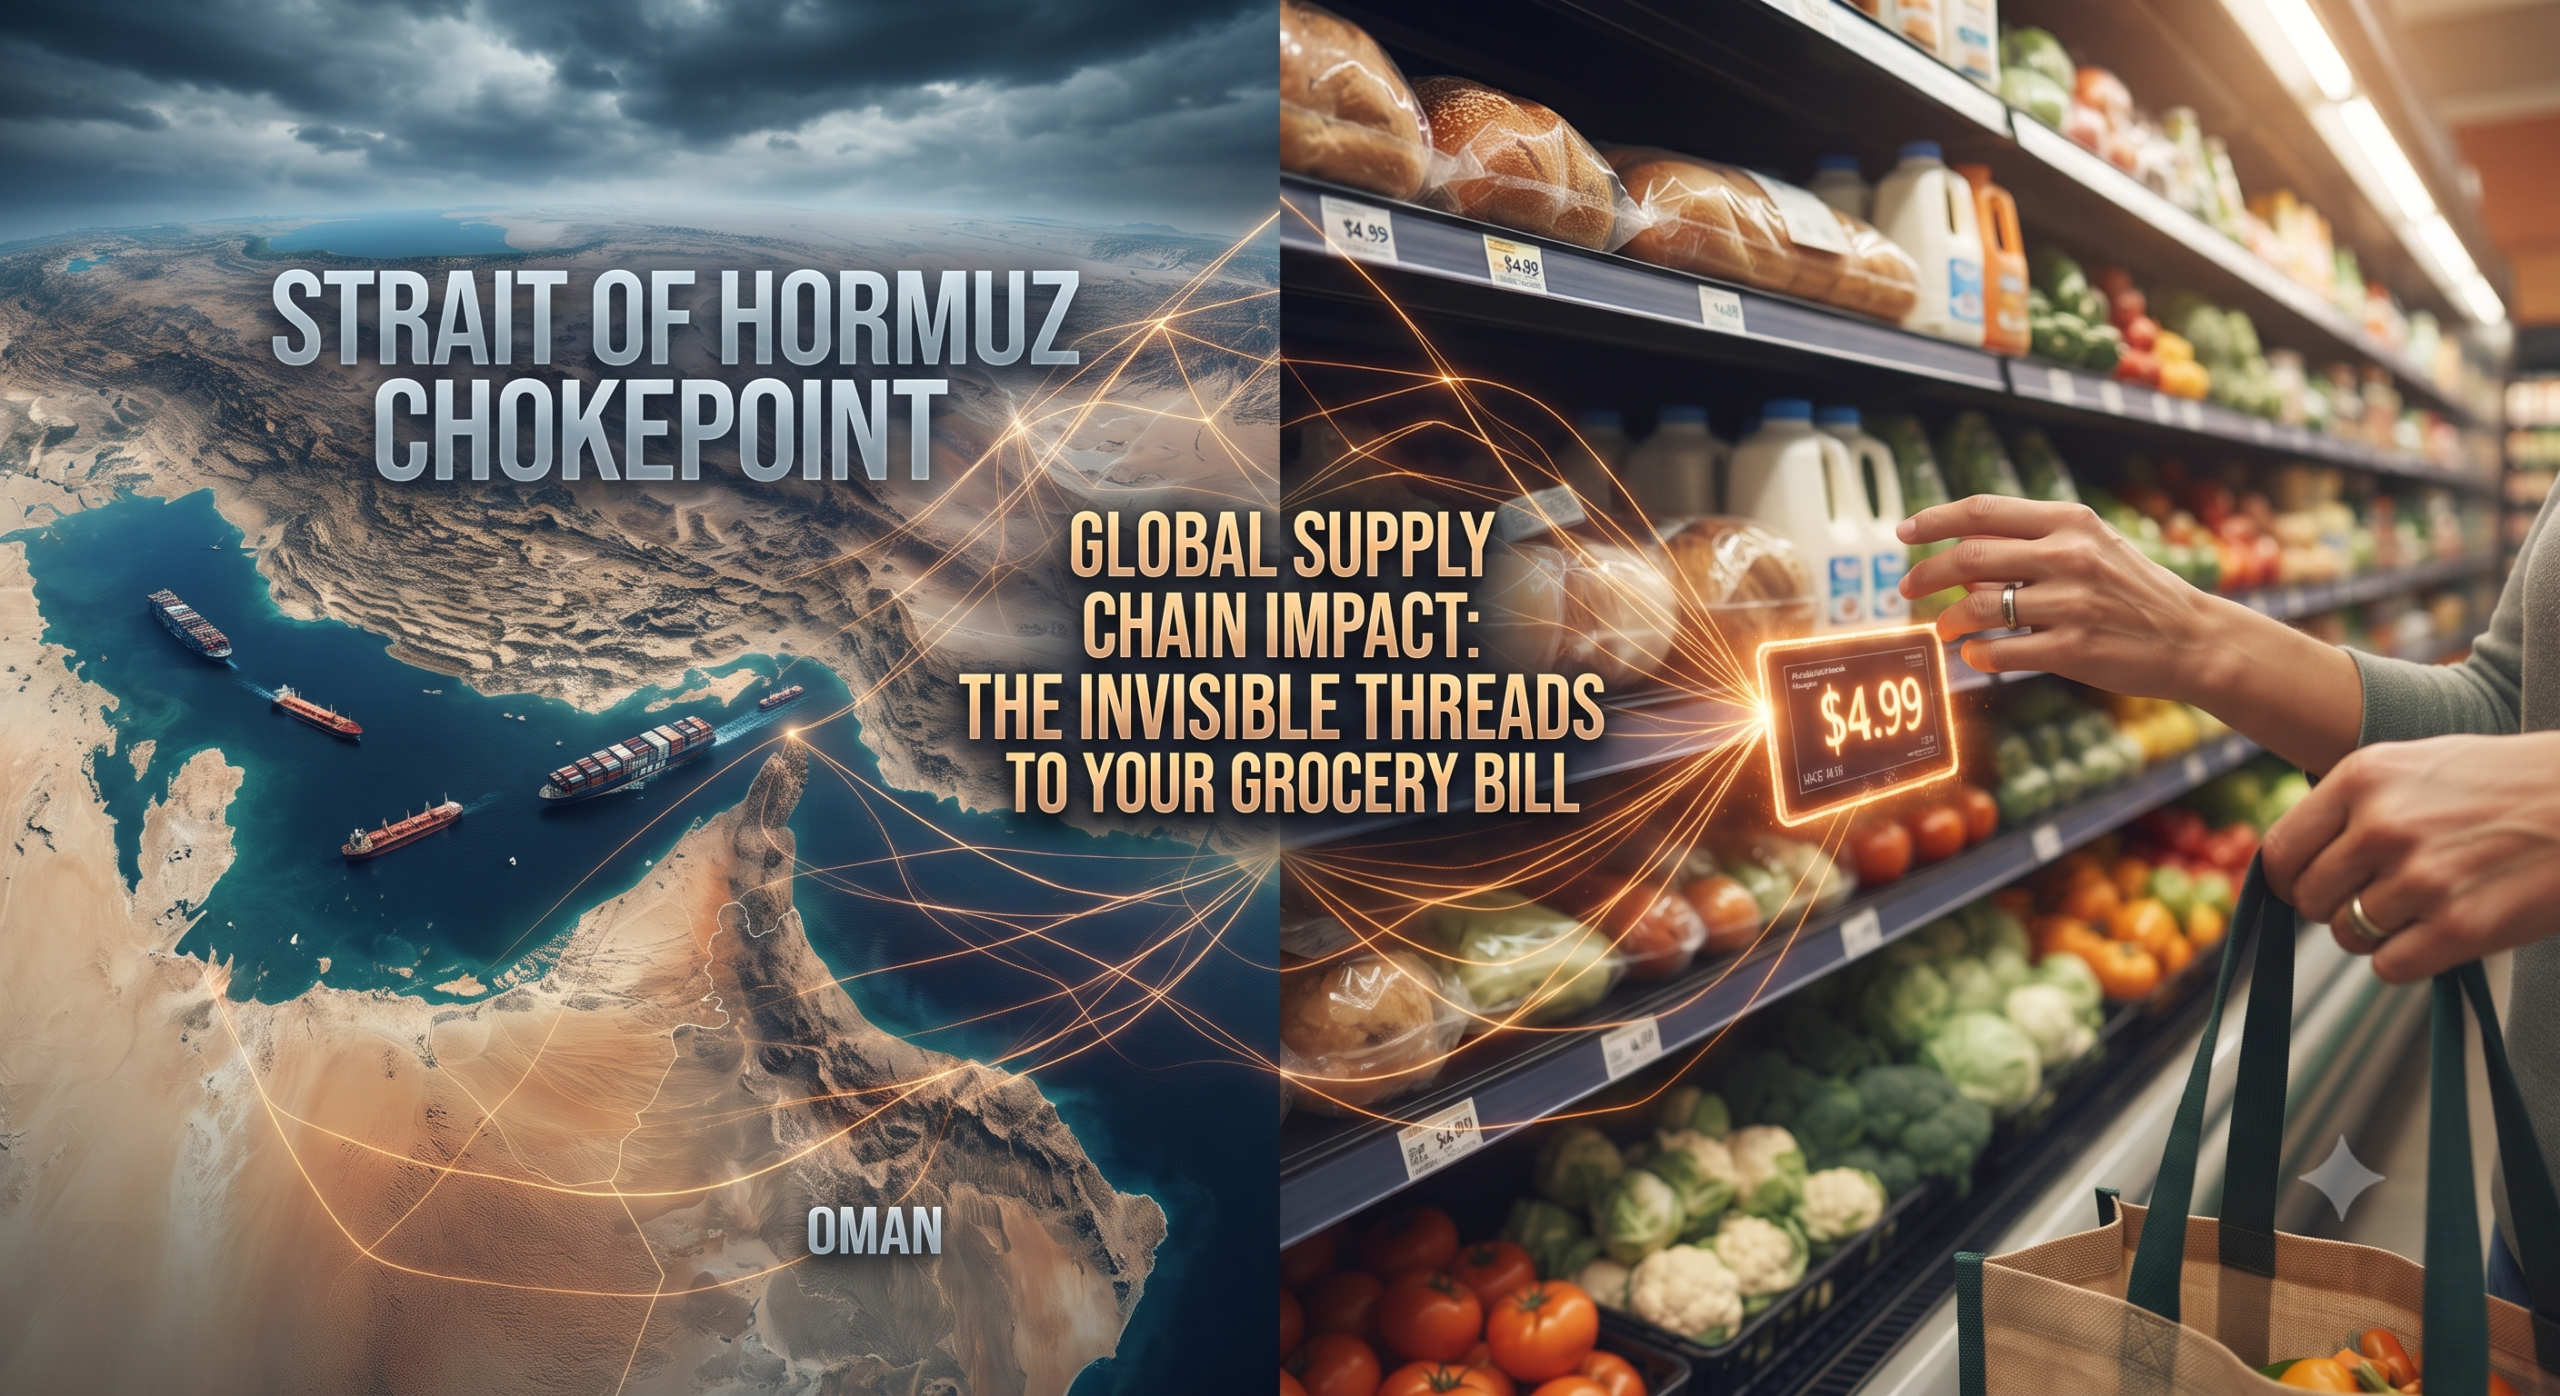
1. Introduction: The Butterfly Effect of 2026 When evaluating what drives your Strait of Hormuz grocery bill higher each week, the connection between Middle Eastern maritime chokepoints and your local
Thirsty Air and Flame-Tied Cats: 6 Surprising Realities of the 2026 Global Heat CrisisThirsty Air and Flame-Tied Cats: 6 Surprising Realities of the 2026 Global Heat Crisis
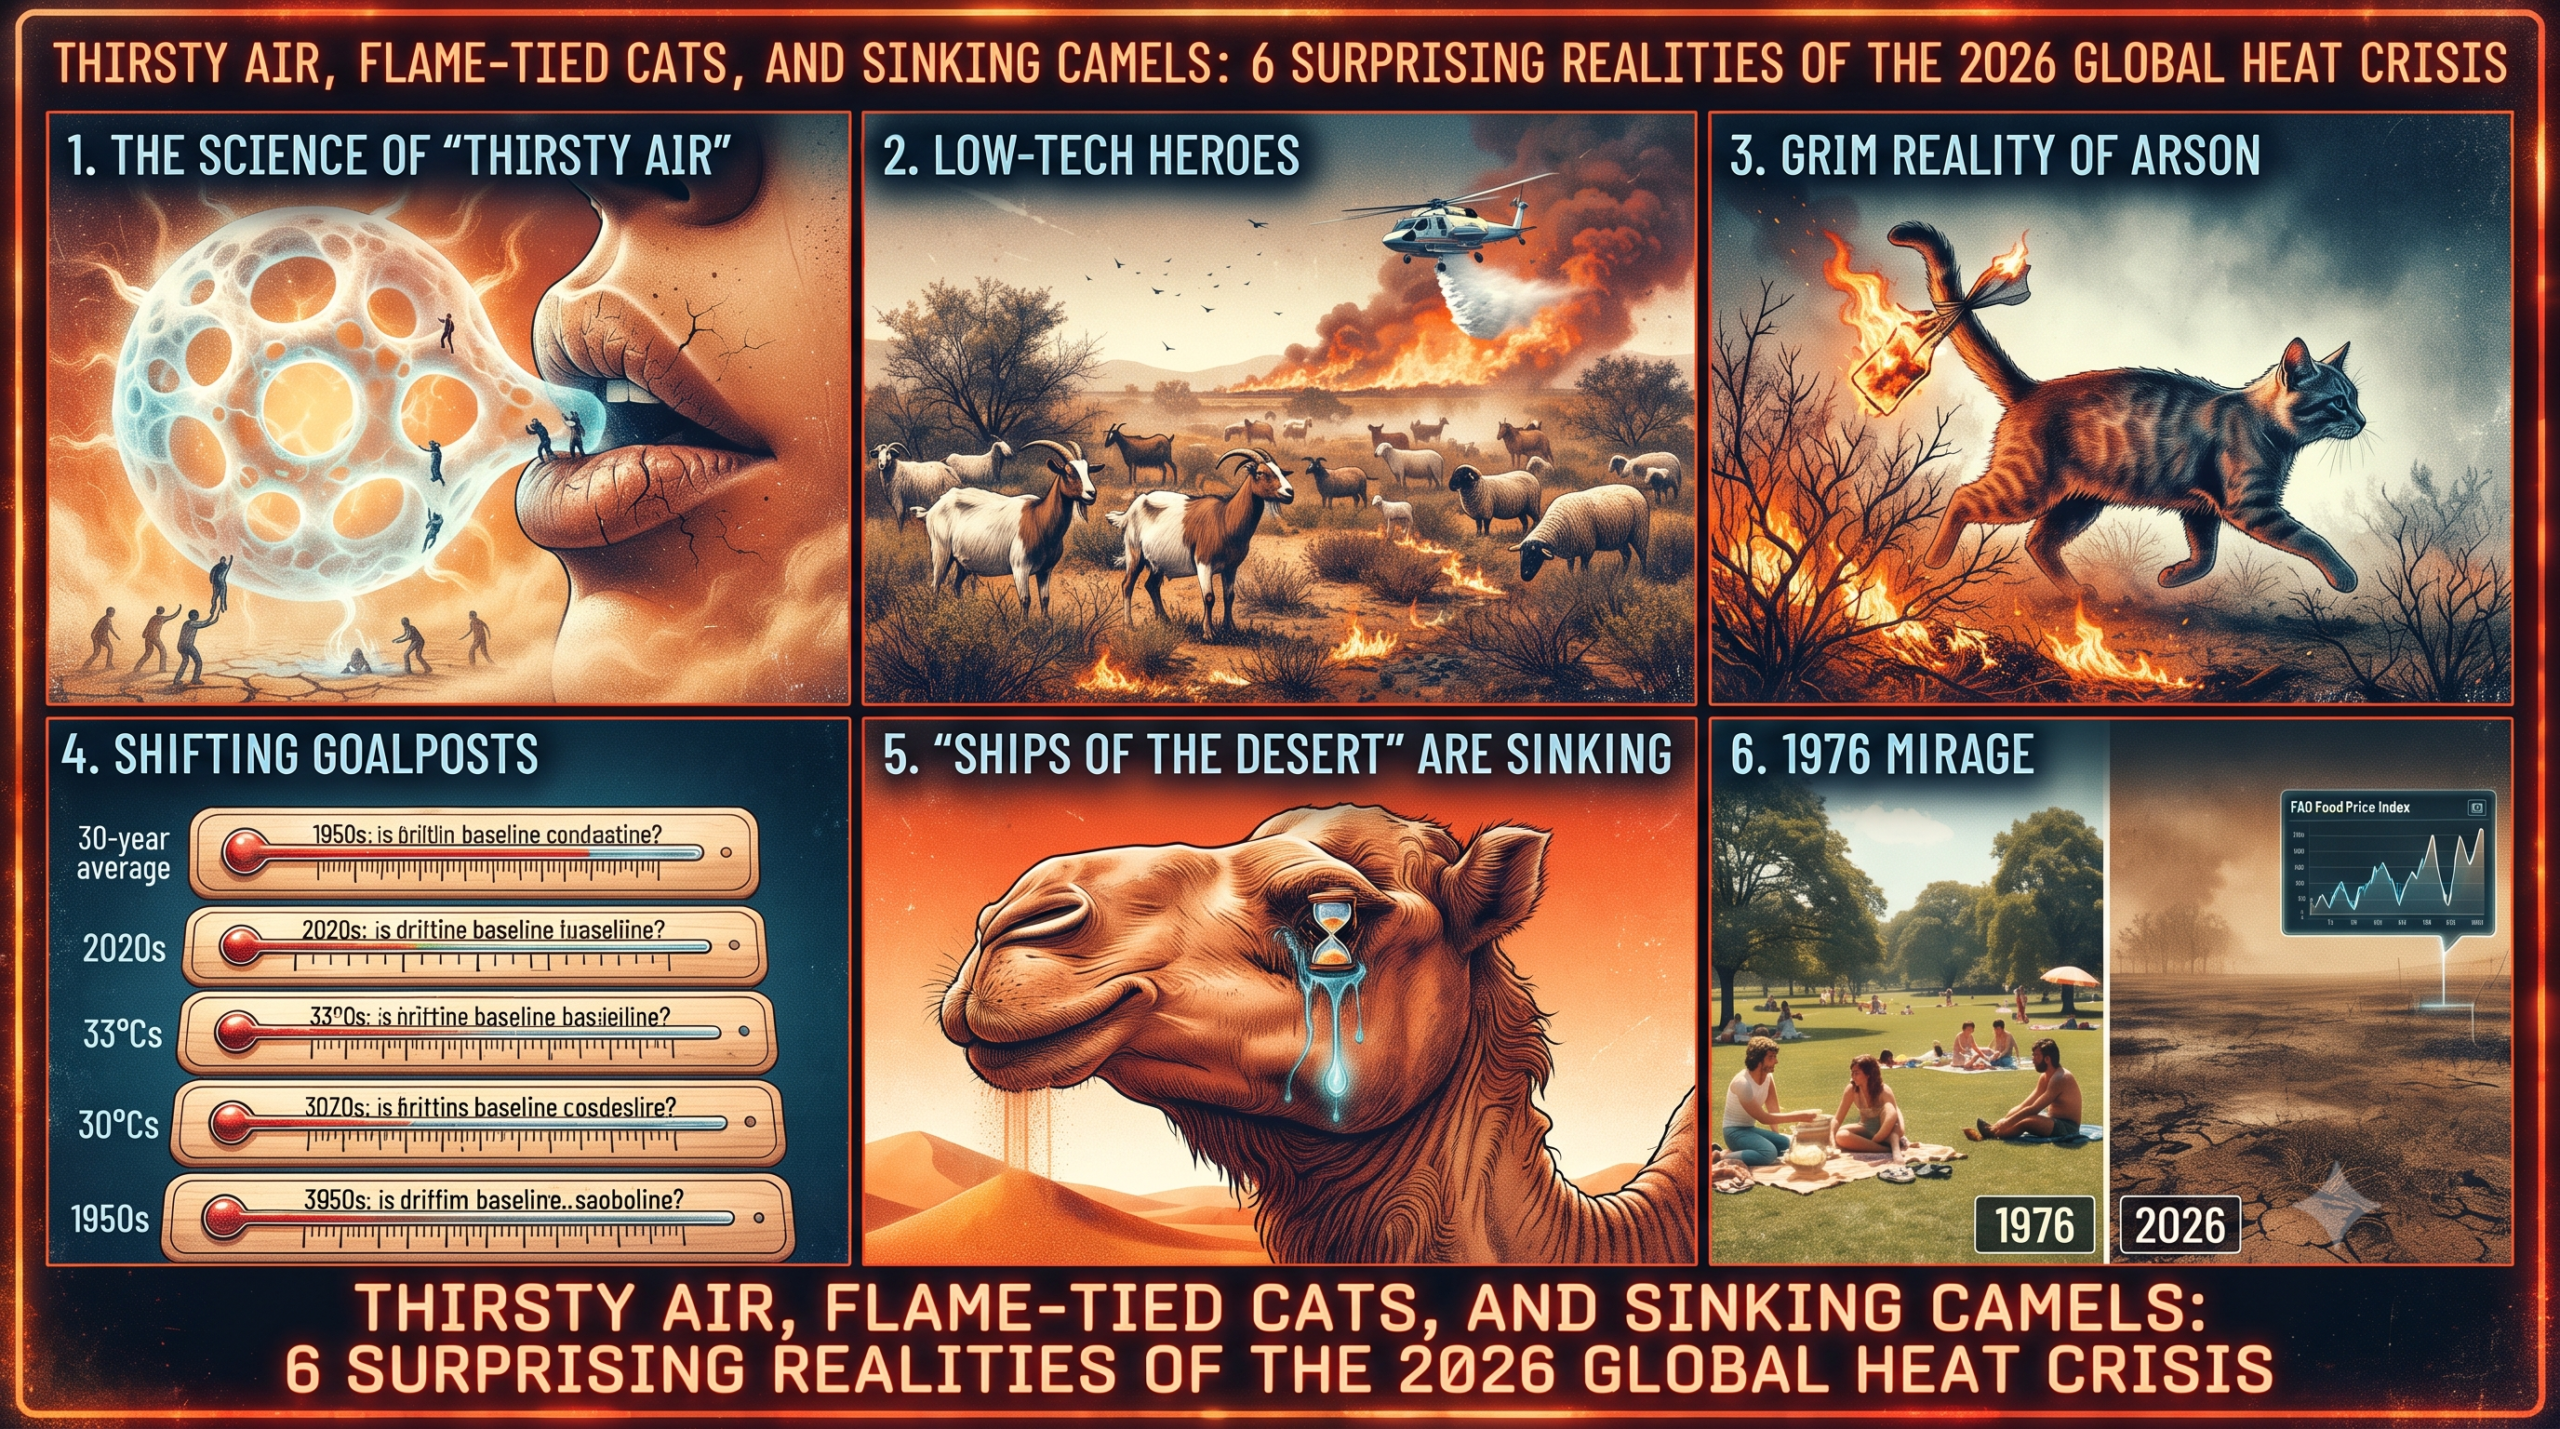
The 2026 global heat crisis has transformed the global landscape into a theater of extremes. From the scorched fields of France and Spain to the rare drought alerts in North
Global Weather Crisis Reaches Critical 91.2 Score on GCI IndexGlobal Weather Crisis Reaches Critical 91.2 Score on GCI Index
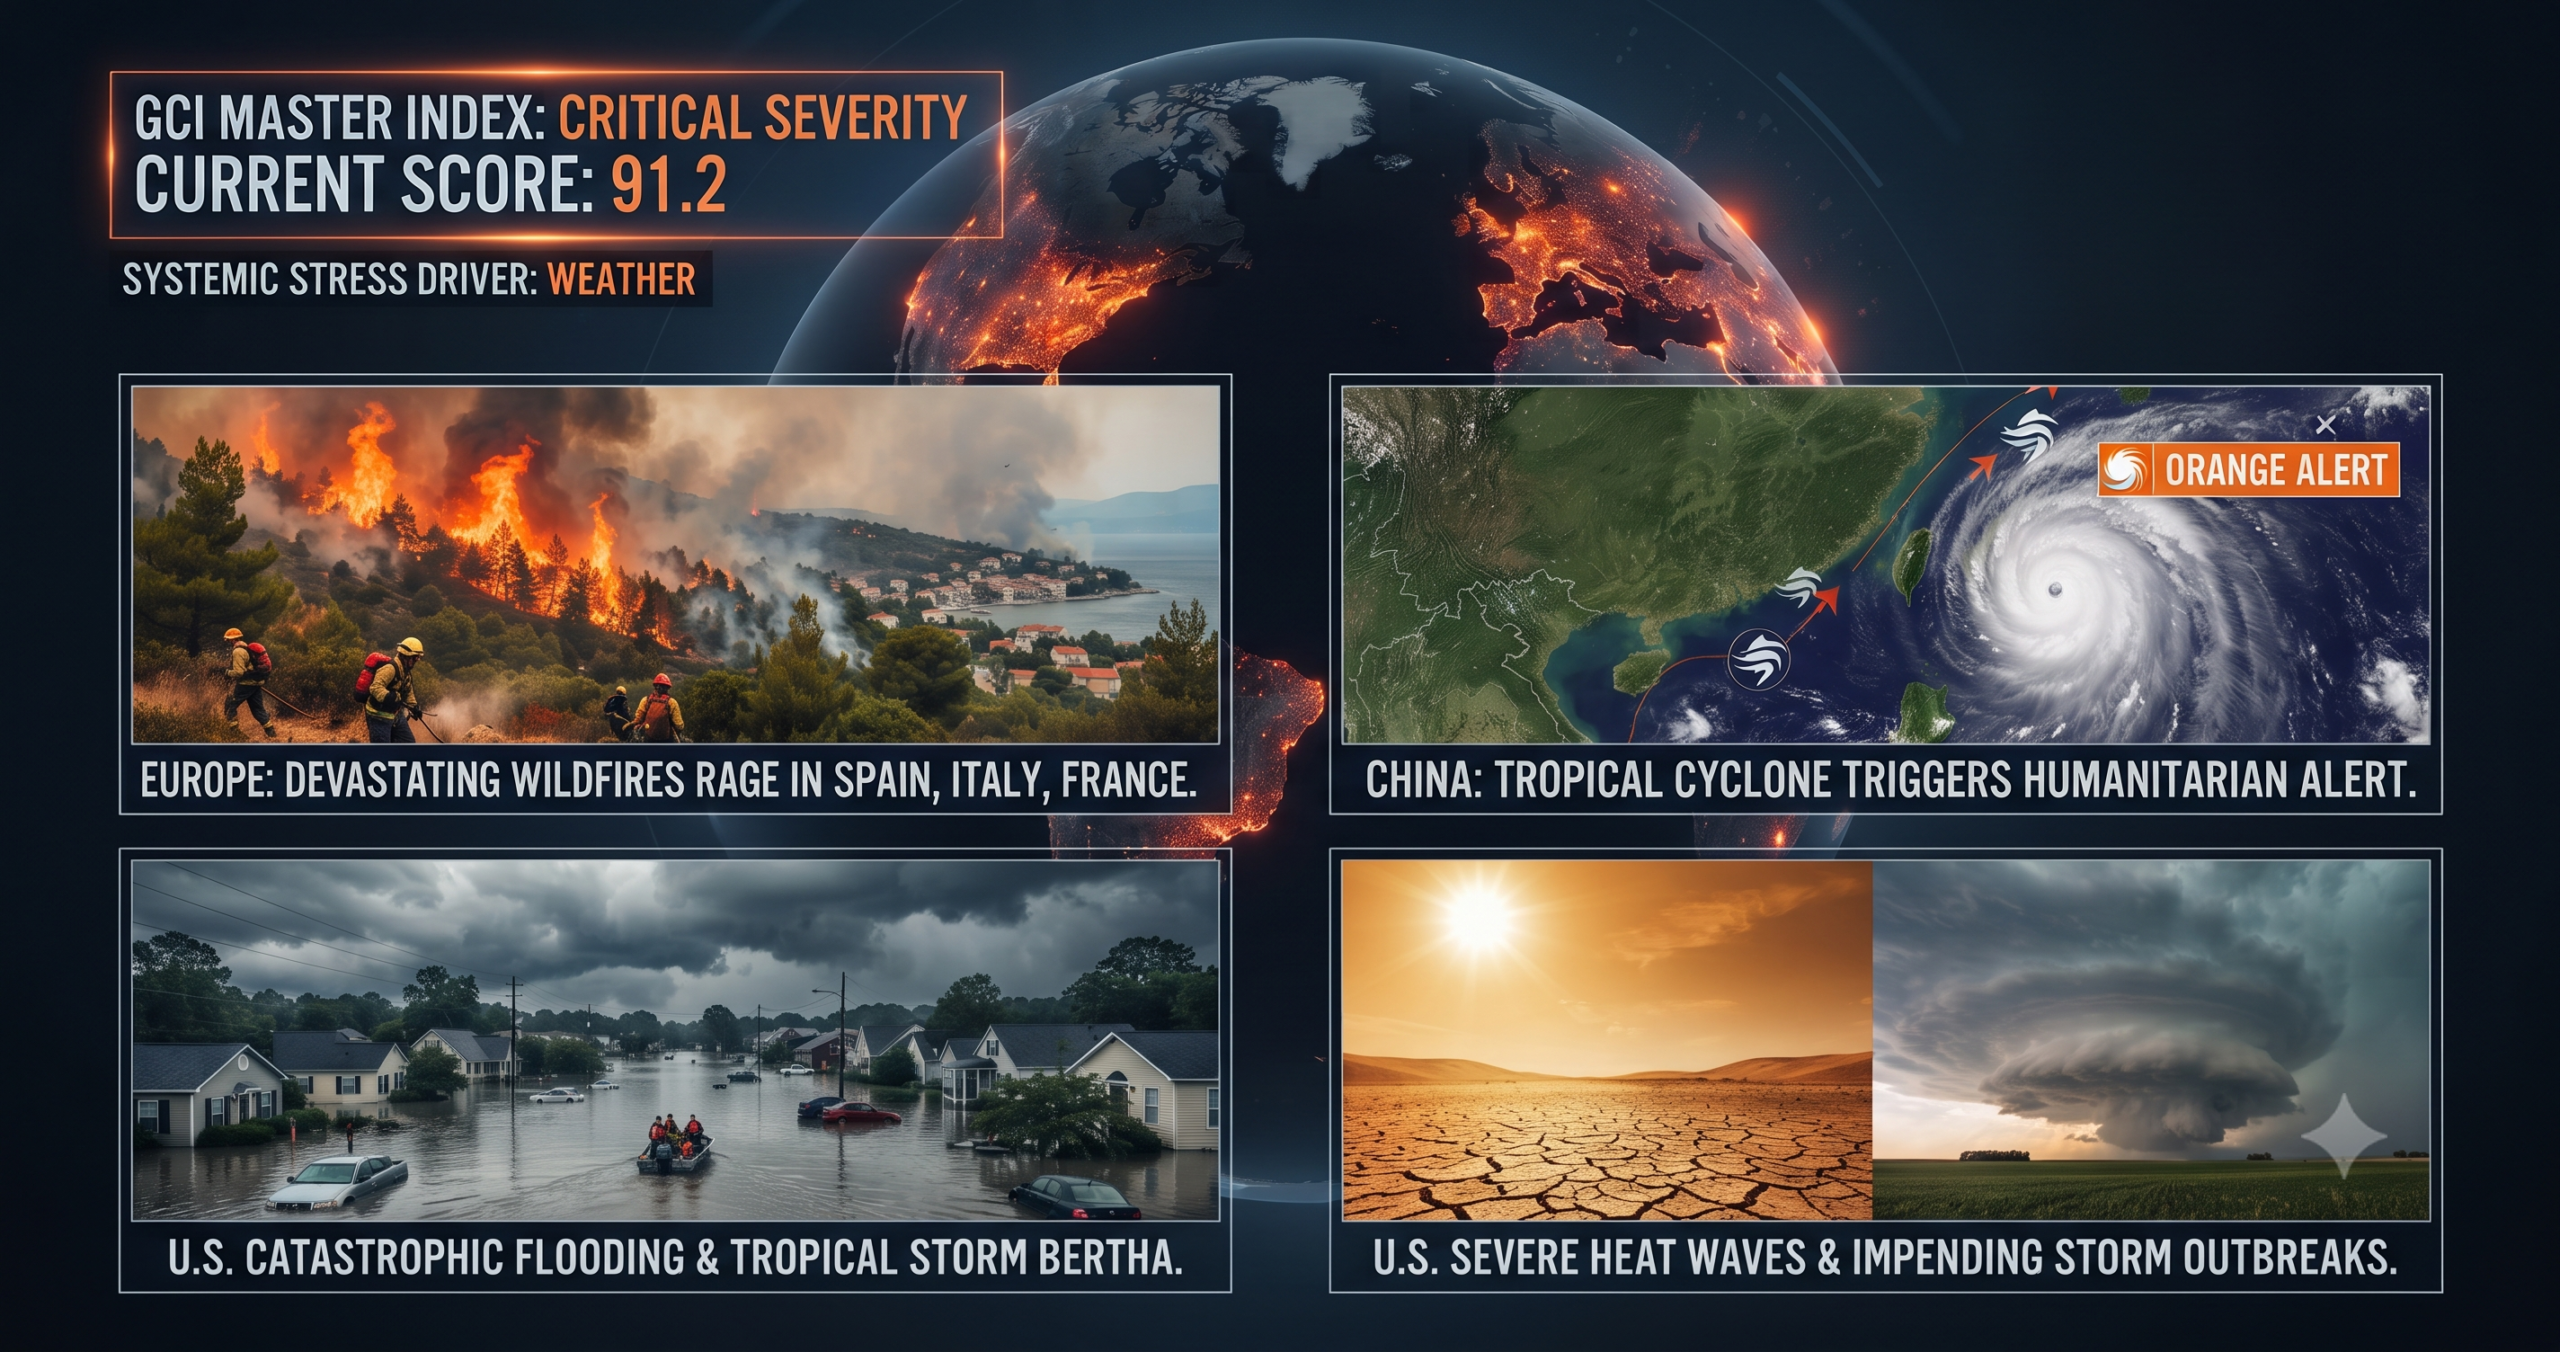
A global weather crisis is currently unfolding across multiple continents, with the overall severity classified as CRITICAL and holding an unprecedented score of 91.2 out of 100 on the GCI
Weather Extremes: Two Perspectives, One Reality: Why Our Weather is ChangingWeather Extremes: Two Perspectives, One Reality: Why Our Weather is Changing

Turn on the news or look out across the landscape, and a common theme emerges: Weather extremes, the weather is changing, and not for the better. Whether you talk to
After the Convergence: Assessing the Mid-Week Fallout and What Comes Next in this Global Risk BriefingAfter the Convergence: Assessing the Mid-Week Fallout and What Comes Next in this Global Risk Briefing
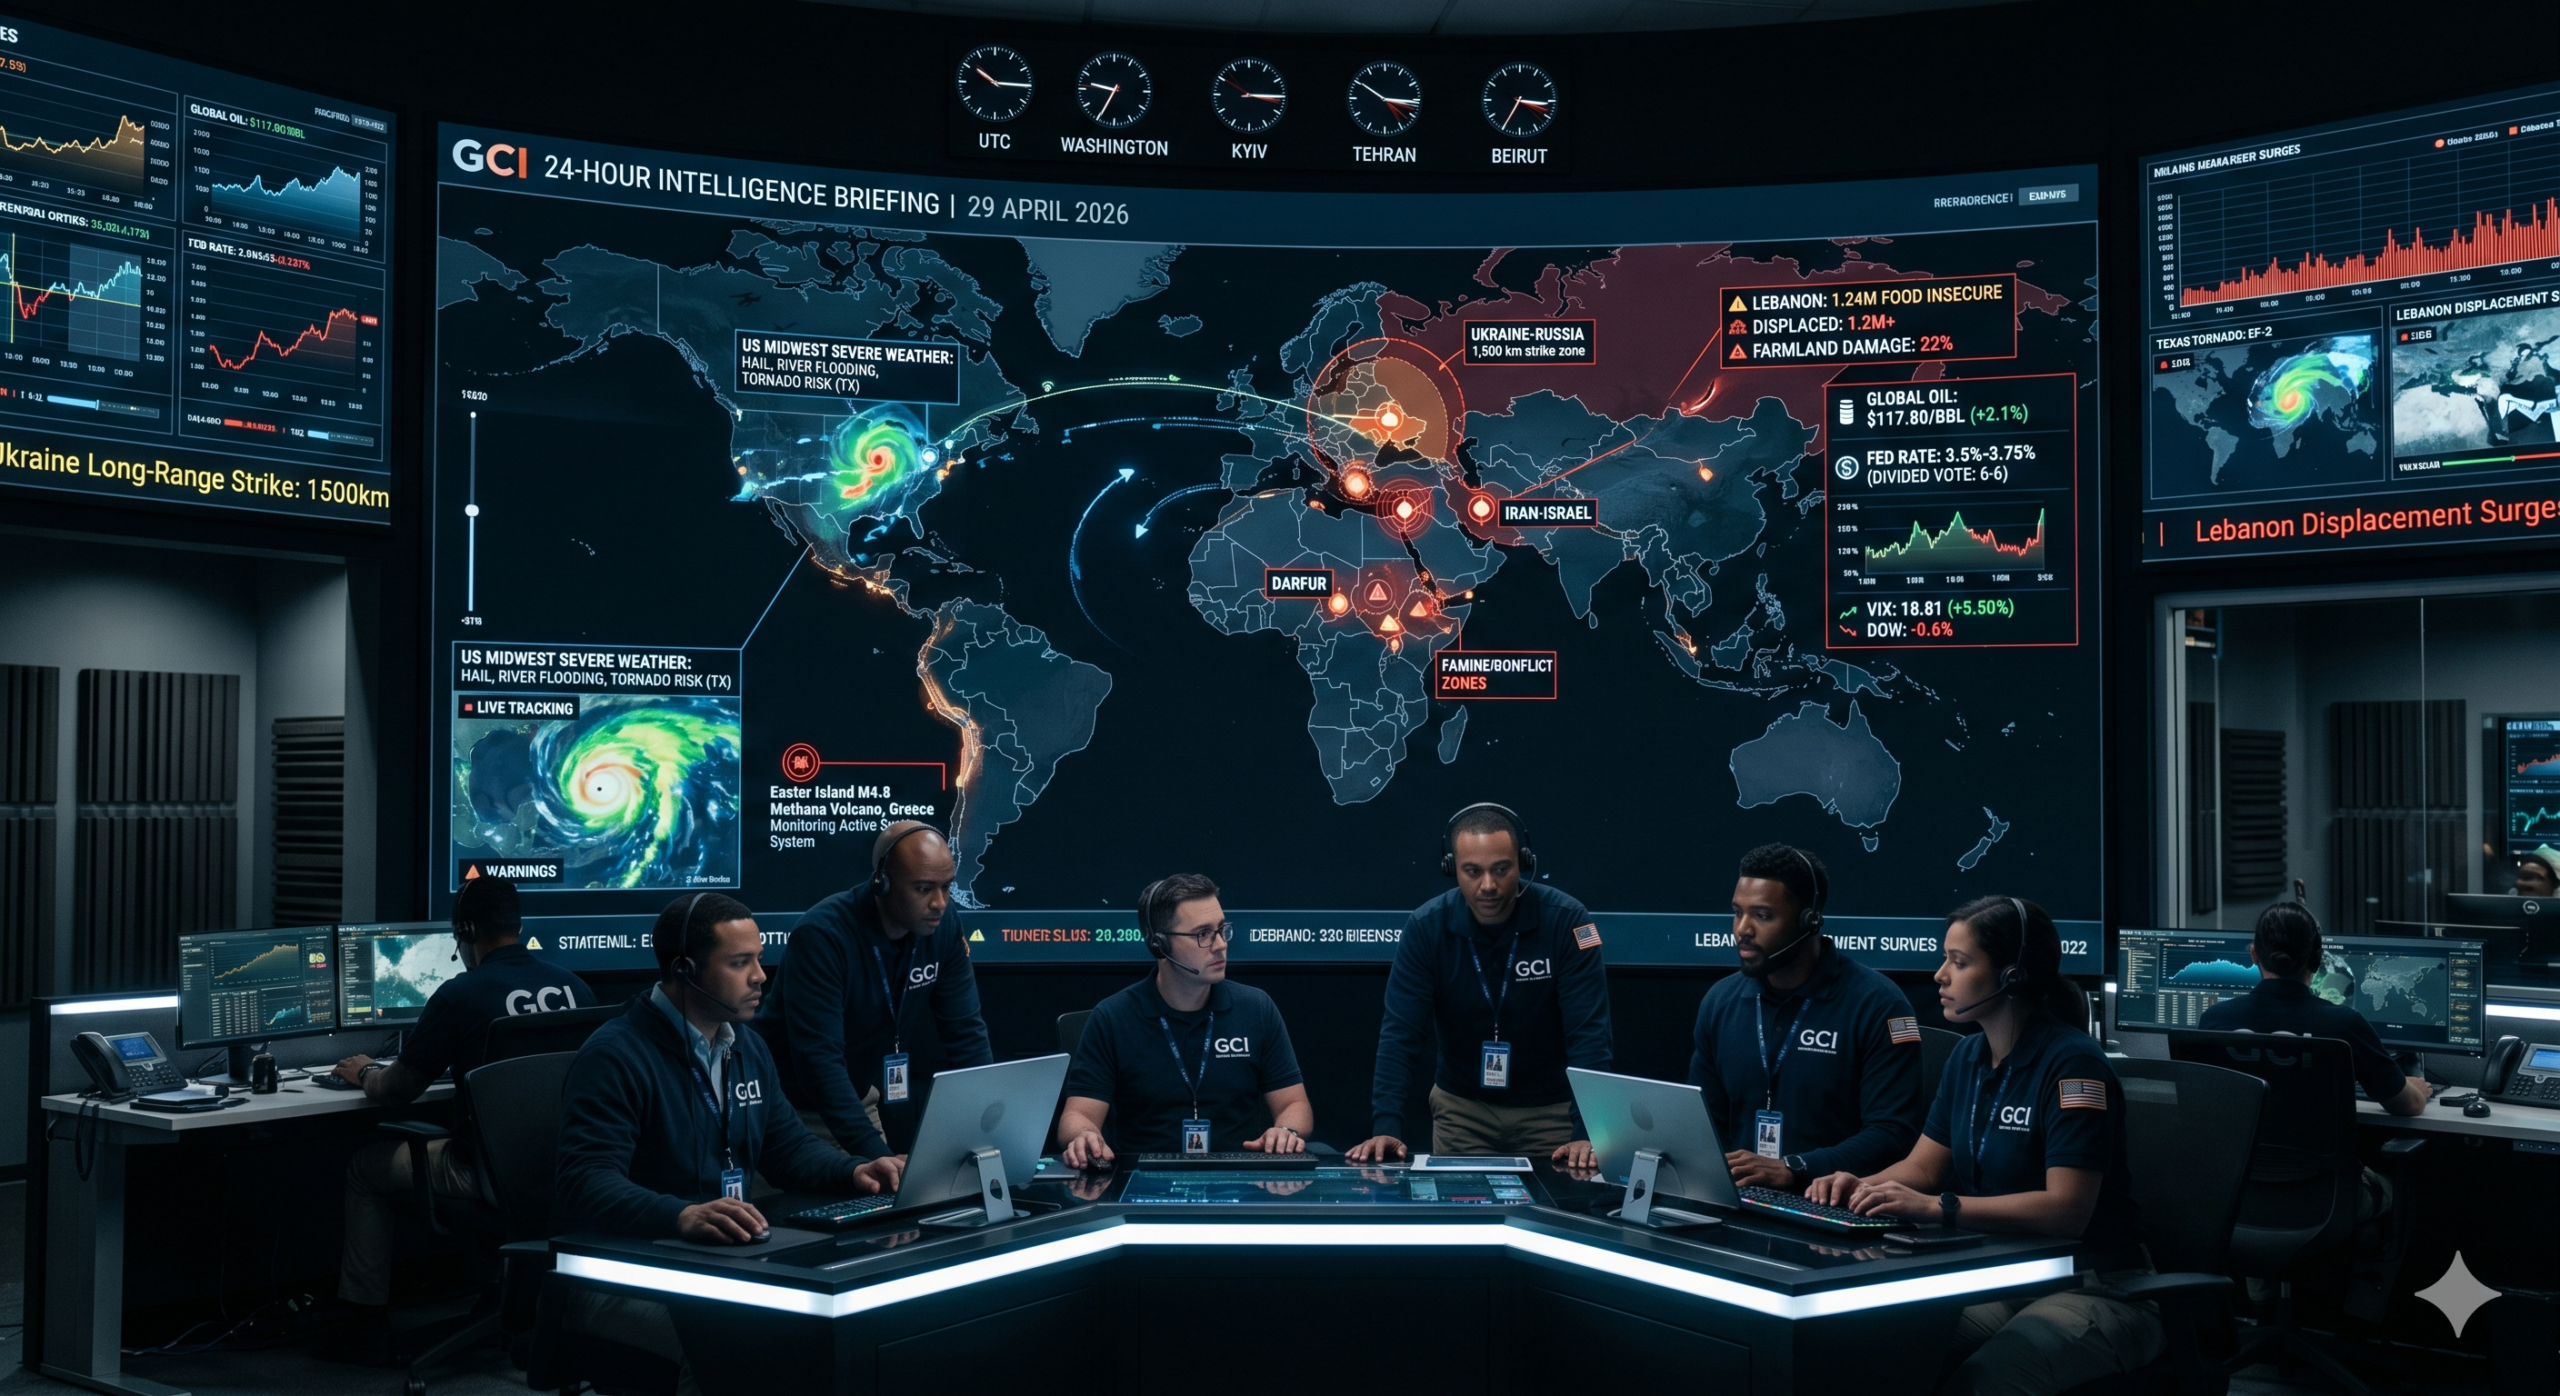
In this weeks Global Risk Briefing the atmospheric equilibrium of early July didn’t just break—it shattered. Earlier this week, as the “quiet part” of the seasonal forecast expired, millions found